
Advertisement
- Malaysia
- /
- Wireless Telecom
- /
- KLSE:CDB
Celcomdigi Berhad's (KLSE:CDB) Intrinsic Value Is Potentially 34% Above Its Share Price

Key Insights
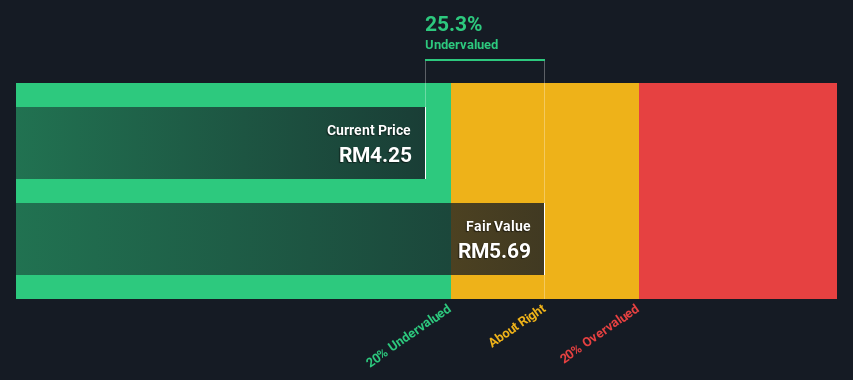
- Using the 2 Stage Free Cash Flow to Equity, Celcomdigi Berhad fair value estimate is RM5.69
- Celcomdigi Berhad's RM4.25 share price signals that it might be 25% undervalued
- Our fair value estimate is 23% higher than Celcomdigi Berhad's analyst price target of RM4.64
How far off is Celcomdigi Berhad (KLSE:CDB) from its intrinsic value? Using the most recent financial data, we'll take a look at whether the stock is fairly priced by estimating the company's future cash flows and discounting them to their present value. One way to achieve this is by employing the Discounted Cash Flow (DCF) model. Models like these may appear beyond the comprehension of a lay person, but they're fairly easy to follow.
Companies can be valued in a lot of ways, so we would point out that a DCF is not perfect for every situation. If you still have some burning questions about this type of valuation, take a look at the Simply Wall St analysis model.
Check out our latest analysis for Celcomdigi Berhad
Step By Step Through The Calculation
We use what is known as a 2-stage model, which simply means we have two different periods of growth rates for the company's cash flows. Generally the first stage is higher growth, and the second stage is a lower growth phase. In the first stage we need to estimate the cash flows to the business over the next ten years. Where possible we use analyst estimates, but when these aren't available we extrapolate the previous free cash flow (FCF) from the last estimate or reported value. We assume companies with shrinking free cash flow will slow their rate of shrinkage, and that companies with growing free cash flow will see their growth rate slow, over this period. We do this to reflect that growth tends to slow more in the early years than it does in later years.
A DCF is all about the idea that a dollar in the future is less valuable than a dollar today, so we discount the value of these future cash flows to their estimated value in today's dollars:
10-year free cash flow (FCF) forecast
| 2024 | 2025 | 2026 | 2027 | 2028 | 2029 | 2030 | 2031 | 2032 | 2033 | |
| Levered FCF (MYR, Millions) | RM2.83b | RM3.30b | RM4.10b | RM4.08b | RM4.10b | RM4.16b | RM4.25b | RM4.36b | RM4.49b | RM4.62b |
| Growth Rate Estimate Source | Analyst x6 | Analyst x7 | Analyst x4 | Analyst x1 | Est @ 0.65% | Est @ 1.51% | Est @ 2.12% | Est @ 2.55% | Est @ 2.84% | Est @ 3.05% |
| Present Value (MYR, Millions) Discounted @ 8.6% | RM2.6k | RM2.8k | RM3.2k | RM2.9k | RM2.7k | RM2.5k | RM2.4k | RM2.3k | RM2.1k | RM2.0k |
("Est" = FCF growth rate estimated by Simply Wall St)
Present Value of 10-year Cash Flow (PVCF) = RM26b
We now need to calculate the Terminal Value, which accounts for all the future cash flows after this ten year period. The Gordon Growth formula is used to calculate Terminal Value at a future annual growth rate equal to the 5-year average of the 10-year government bond yield of 3.5%. We discount the terminal cash flows to today's value at a cost of equity of 8.6%.
Terminal Value (TV)= FCF2033 × (1 + g) ÷ (r – g) = RM4.6b× (1 + 3.5%) ÷ (8.6%– 3.5%) = RM94b
Present Value of Terminal Value (PVTV)= TV / (1 + r)10= RM94b÷ ( 1 + 8.6%)10= RM41b
The total value, or equity value, is then the sum of the present value of the future cash flows, which in this case is RM67b. The last step is to then divide the equity value by the number of shares outstanding. Relative to the current share price of RM4.3, the company appears a touch undervalued at a 25% discount to where the stock price trades currently. The assumptions in any calculation have a big impact on the valuation, so it is better to view this as a rough estimate, not precise down to the last cent.
Important Assumptions
We would point out that the most important inputs to a discounted cash flow are the discount rate and of course the actual cash flows. If you don't agree with these result, have a go at the calculation yourself and play with the assumptions. The DCF also does not consider the possible cyclicality of an industry, or a company's future capital requirements, so it does not give a full picture of a company's potential performance. Given that we are looking at Celcomdigi Berhad as potential shareholders, the cost of equity is used as the discount rate, rather than the cost of capital (or weighted average cost of capital, WACC) which accounts for debt. In this calculation we've used 8.6%, which is based on a levered beta of 0.800. Beta is a measure of a stock's volatility, compared to the market as a whole. We get our beta from the industry average beta of globally comparable companies, with an imposed limit between 0.8 and 2.0, which is a reasonable range for a stable business.
SWOT Analysis for Celcomdigi Berhad
Strength
- Earnings growth over the past year exceeded the industry.
- Debt is well covered by earnings and cashflows.
Weakness
- Dividend is low compared to the top 25% of dividend payers in the Wireless Telecom market.
Opportunity
- Annual earnings are forecast to grow faster than the Malaysian market.
- Trading below our estimate of fair value by more than 20%.
Threat
- Dividends are not covered by earnings.
- Annual revenue is forecast to grow slower than the Malaysian market.
Next Steps:
Whilst important, the DCF calculation is only one of many factors that you need to assess for a company. The DCF model is not a perfect stock valuation tool. Preferably you'd apply different cases and assumptions and see how they would impact the company's valuation. If a company grows at a different rate, or if its cost of equity or risk free rate changes sharply, the output can look very different. Why is the intrinsic value higher than the current share price? For Celcomdigi Berhad, there are three relevant elements you should consider:
- Risks: To that end, you should be aware of the 2 warning signs we've spotted with Celcomdigi Berhad .
- Future Earnings: How does CDB's growth rate compare to its peers and the wider market? Dig deeper into the analyst consensus number for the upcoming years by interacting with our free analyst growth expectation chart.
- Other High Quality Alternatives: Do you like a good all-rounder? Explore our interactive list of high quality stocks to get an idea of what else is out there you may be missing!
PS. Simply Wall St updates its DCF calculation for every Malaysian stock every day, so if you want to find the intrinsic value of any other stock just search here.
New: AI Stock Screener & Alerts
Our new AI Stock Screener scans the market every day to uncover opportunities.
• Dividend Powerhouses (3%+ Yield)
• Undervalued Small Caps with Insider Buying
• High growth Tech and AI Companies
Or build your own from over 50 metrics.
Have feedback on this article? Concerned about the content? Get in touch with us directly. Alternatively, email editorial-team (at) simplywallst.com.
This article by Simply Wall St is general in nature. We provide commentary based on historical data and analyst forecasts only using an unbiased methodology and our articles are not intended to be financial advice. It does not constitute a recommendation to buy or sell any stock, and does not take account of your objectives, or your financial situation. We aim to bring you long-term focused analysis driven by fundamental data. Note that our analysis may not factor in the latest price-sensitive company announcements or qualitative material. Simply Wall St has no position in any stocks mentioned.
About KLSE:CDB
Celcomdigi Berhad
An investment holding company, provides mobile communication services and related products in Malaysia.
Fair value with mediocre balance sheet.
Market Insights


Advertisement
Community Narratives
Nike's Direct-to-Consumer Focus Will Drive Future Growth
Fair Value US$87.90|22.7% undervalued
UN
Community Contributor
Novo Nordisk will dominate GLP-1 market with Ozempic and Wegovy growth
Fair Value US$89.59|14.2% undervalued
BE
Community Contributor
Rheinmetall could get 20-25% of EU-NATO 3%-GDP defence spending
Fair Value €7.57k|82.8% undervalued
NO
Community Contributor