- Malaysia
- /
- Electronic Equipment and Components
- /
- KLSE:PNEPCB
Why Investors Shouldn't Be Surprised By PNE PCB Berhad's (KLSE:PNEPCB) 31% Share Price Plunge

PNE PCB Berhad (KLSE:PNEPCB) shareholders won't be pleased to see that the share price has had a very rough month, dropping 31% and undoing the prior period's positive performance. The drop over the last 30 days has capped off a tough year for shareholders, with the share price down 18% in that time.
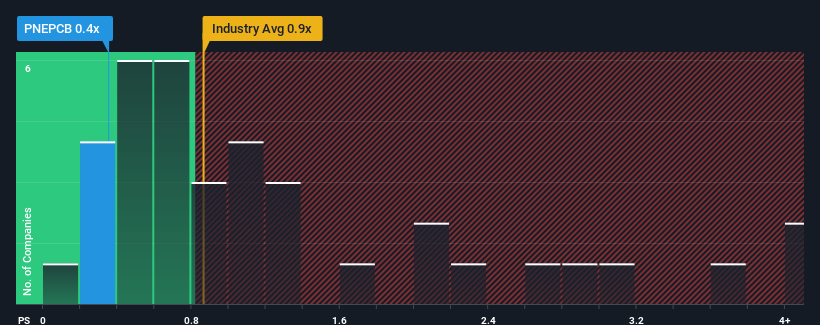
Since its price has dipped substantially, when close to half the companies operating in Malaysia's Electronic industry have price-to-sales ratios (or "P/S") above 0.9x, you may consider PNE PCB Berhad as an enticing stock to check out with its 0.4x P/S ratio. However, the P/S might be low for a reason and it requires further investigation to determine if it's justified.
We've discovered 4 warning signs about PNE PCB Berhad. View them for free.View our latest analysis for PNE PCB Berhad
What Does PNE PCB Berhad's Recent Performance Look Like?
The revenue growth achieved at PNE PCB Berhad over the last year would be more than acceptable for most companies. It might be that many expect the respectable revenue performance to degrade substantially, which has repressed the P/S. Those who are bullish on PNE PCB Berhad will be hoping that this isn't the case, so that they can pick up the stock at a lower valuation.
We don't have analyst forecasts, but you can see how recent trends are setting up the company for the future by checking out our free report on PNE PCB Berhad's earnings, revenue and cash flow.Is There Any Revenue Growth Forecasted For PNE PCB Berhad?
There's an inherent assumption that a company should underperform the industry for P/S ratios like PNE PCB Berhad's to be considered reasonable.
Taking a look back first, we see that the company grew revenue by an impressive 28% last year. However, this wasn't enough as the latest three year period has seen the company endure a nasty 20% drop in revenue in aggregate. So unfortunately, we have to acknowledge that the company has not done a great job of growing revenues over that time.
Comparing that to the industry, which is predicted to deliver 12% growth in the next 12 months, the company's downward momentum based on recent medium-term revenue results is a sobering picture.
With this in mind, we understand why PNE PCB Berhad's P/S is lower than most of its industry peers. Nonetheless, there's no guarantee the P/S has reached a floor yet with revenue going in reverse. Even just maintaining these prices could be difficult to achieve as recent revenue trends are already weighing down the shares.
The Bottom Line On PNE PCB Berhad's P/S
The southerly movements of PNE PCB Berhad's shares means its P/S is now sitting at a pretty low level. Using the price-to-sales ratio alone to determine if you should sell your stock isn't sensible, however it can be a practical guide to the company's future prospects.
Our examination of PNE PCB Berhad confirms that the company's shrinking revenue over the past medium-term is a key factor in its low price-to-sales ratio, given the industry is projected to grow. At this stage investors feel the potential for an improvement in revenue isn't great enough to justify a higher P/S ratio. If recent medium-term revenue trends continue, it's hard to see the share price moving strongly in either direction in the near future under these circumstances.
And what about other risks? Every company has them, and we've spotted 4 warning signs for PNE PCB Berhad (of which 3 are significant!) you should know about.
If companies with solid past earnings growth is up your alley, you may wish to see this free collection of other companies with strong earnings growth and low P/E ratios.
The New Payments ETF Is Live on NASDAQ:
Money is moving to real-time rails, and a newly listed ETF now gives investors direct exposure. Fast settlement. Institutional custody. Simple access.
Explore how this launch could reshape portfolios
Sponsored ContentNew: Manage All Your Stock Portfolios in One Place
We've created the ultimate portfolio companion for stock investors, and it's free.
• Connect an unlimited number of Portfolios and see your total in one currency
• Be alerted to new Warning Signs or Risks via email or mobile
• Track the Fair Value of your stocks
Have feedback on this article? Concerned about the content? Get in touch with us directly. Alternatively, email editorial-team (at) simplywallst.com.
This article by Simply Wall St is general in nature. We provide commentary based on historical data and analyst forecasts only using an unbiased methodology and our articles are not intended to be financial advice. It does not constitute a recommendation to buy or sell any stock, and does not take account of your objectives, or your financial situation. We aim to bring you long-term focused analysis driven by fundamental data. Note that our analysis may not factor in the latest price-sensitive company announcements or qualitative material. Simply Wall St has no position in any stocks mentioned.
About KLSE:PNEPCB
PNE PCB Berhad
An investment holding company, manufactures and sells printed circuit boards in Indonesia, Japan, Malaysia, Vietnam, and the People’s Republic of China.
Flawless balance sheet with low risk.
Market Insights

Weekly Picks

THE KINGDOM OF BROWN GOODS: WHY MGPI IS BEING CRUSHED BY INVENTORY & PRIMED FOR RESURRECTION


Why Vertical Aerospace (NYSE: EVTL) is Worth Possibly Over 13x its Current Price


The Quiet Giant That Became AI’s Power Grid
Recently Updated Narratives


MINISO's fair value is projected at 26.69 with an anticipated PE ratio shift of 20x

Fiverr International will transform the freelance industry with AI-powered growth

Stride Stock: Online Education Finds Its Second Act
Popular Narratives


MicroVision will explode future revenue by 380.37% with a vision towards success


Crazy Undervalued 42 Baggers Silver Play (Active & Running Mine)


