Techbond Group Berhad's (KLSE:TECHBND) Stock Has Seen Strong Momentum: Does That Call For Deeper Study Of Its Financial Prospects?

Techbond Group Berhad's (KLSE:TECHBND) stock is up by a considerable 13% over the past week. Given that stock prices are usually aligned with a company's financial performance in the long-term, we decided to study its financial indicators more closely to see if they had a hand to play in the recent price move. In this article, we decided to focus on Techbond Group Berhad's ROE.
Return on Equity or ROE is a test of how effectively a company is growing its value and managing investors’ money. Put another way, it reveals the company's success at turning shareholder investments into profits.
Check out our latest analysis for Techbond Group Berhad
How Is ROE Calculated?
Return on equity can be calculated by using the formula:
Return on Equity = Net Profit (from continuing operations) ÷ Shareholders' Equity
So, based on the above formula, the ROE for Techbond Group Berhad is:
7.3% = RM15m ÷ RM210m (Based on the trailing twelve months to September 2024).
The 'return' is the income the business earned over the last year. That means that for every MYR1 worth of shareholders' equity, the company generated MYR0.07 in profit.
Why Is ROE Important For Earnings Growth?
So far, we've learned that ROE is a measure of a company's profitability. We now need to evaluate how much profit the company reinvests or "retains" for future growth which then gives us an idea about the growth potential of the company. Assuming all else is equal, companies that have both a higher return on equity and higher profit retention are usually the ones that have a higher growth rate when compared to companies that don't have the same features.
Techbond Group Berhad's Earnings Growth And 7.3% ROE
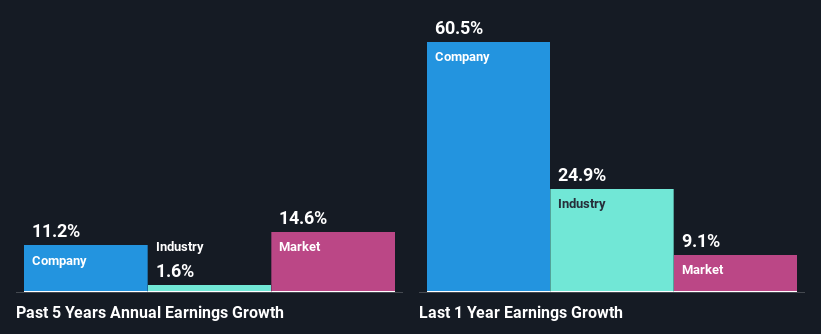
When you first look at it, Techbond Group Berhad's ROE doesn't look that attractive. However, given that the company's ROE is similar to the average industry ROE of 6.4%, we may spare it some thought. On the other hand, Techbond Group Berhad reported a moderate 11% net income growth over the past five years. Taking into consideration that the ROE is not particularly high, we reckon that there could also be other factors at play which could be influencing the company's growth. Such as - high earnings retention or an efficient management in place.
Next, on comparing with the industry net income growth, we found that Techbond Group Berhad's growth is quite high when compared to the industry average growth of 1.6% in the same period, which is great to see.
Earnings growth is an important metric to consider when valuing a stock. It’s important for an investor to know whether the market has priced in the company's expected earnings growth (or decline). Doing so will help them establish if the stock's future looks promising or ominous. Is Techbond Group Berhad fairly valued compared to other companies? These 3 valuation measures might help you decide.
Is Techbond Group Berhad Making Efficient Use Of Its Profits?
Techbond Group Berhad has a three-year median payout ratio of 28%, which implies that it retains the remaining 72% of its profits. This suggests that its dividend is well covered, and given the decent growth seen by the company, it looks like management is reinvesting its earnings efficiently.
Besides, Techbond Group Berhad has been paying dividends over a period of five years. This shows that the company is committed to sharing profits with its shareholders.
Summary
In total, it does look like Techbond Group Berhad has some positive aspects to its business. With a high rate of reinvestment, albeit at a low ROE, the company has managed to see a considerable growth in its earnings. Having said that, looking at the current analyst estimates, we found that the company's earnings are expected to gain momentum. Are these analysts expectations based on the broad expectations for the industry, or on the company's fundamentals? Click here to be taken to our analyst's forecasts page for the company.
Mobile Infrastructure for Defense and Disaster
The next wave in robotics isn't humanoid. Its fully autonomous towers delivering 5G, ISR, and radar in under 30 minutes, anywhere.
Get the investor briefing before the next round of contracts
Sponsored On Behalf of CiTechValuation is complex, but we're here to simplify it.
Discover if Techbond Group Berhad might be undervalued or overvalued with our detailed analysis, featuring fair value estimates, potential risks, dividends, insider trades, and its financial condition.
Access Free AnalysisHave feedback on this article? Concerned about the content? Get in touch with us directly. Alternatively, email editorial-team (at) simplywallst.com.
This article by Simply Wall St is general in nature. We provide commentary based on historical data and analyst forecasts only using an unbiased methodology and our articles are not intended to be financial advice. It does not constitute a recommendation to buy or sell any stock, and does not take account of your objectives, or your financial situation. We aim to bring you long-term focused analysis driven by fundamental data. Note that our analysis may not factor in the latest price-sensitive company announcements or qualitative material. Simply Wall St has no position in any stocks mentioned.
About KLSE:TECHBND
Techbond Group Berhad
Develops, manufactures, and trades in industrial adhesives and sealants in Malaysia, Vietnam, Indonesia, Thailand, China, and internationally.
Solid track record with excellent balance sheet.
Market Insights

Weekly Picks

THE KINGDOM OF BROWN GOODS: WHY MGPI IS BEING CRUSHED BY INVENTORY & PRIMED FOR RESURRECTION


Why Vertical Aerospace (NYSE: EVTL) is Worth Possibly Over 13x its Current Price


The Quiet Giant That Became AI’s Power Grid
Recently Updated Narratives


A case for USD $14.81 per share based on book value. Be warned, this is a micro-cap dependent on a single mine.

Occidental Petroleum to Become Fairly Priced at $68.29 According to Future Projections

Agfa-Gevaert is a digital and materials turnaround opportunity, with growth potential in ZIRFON, but carrying legacy risks.
Popular Narratives


MicroVision will explode future revenue by 380.37% with a vision towards success


Crazy Undervalued 42 Baggers Silver Play (Active & Running Mine)


