
Advertisement
The Returns On Capital At Sinmah Capital Berhad (KLSE:SMCAP) Don't Inspire Confidence

If you're not sure where to start when looking for the next multi-bagger, there are a few key trends you should keep an eye out for. Amongst other things, we'll want to see two things; firstly, a growing return on capital employed (ROCE) and secondly, an expansion in the company's amount of capital employed. If you see this, it typically means it's a company with a great business model and plenty of profitable reinvestment opportunities. Having said that, from a first glance at Sinmah Capital Berhad (KLSE:SMCAP) we aren't jumping out of our chairs at how returns are trending, but let's have a deeper look.
Understanding Return On Capital Employed (ROCE)
Just to clarify if you're unsure, ROCE is a metric for evaluating how much pre-tax income (in percentage terms) a company earns on the capital invested in its business. To calculate this metric for Sinmah Capital Berhad, this is the formula:
Return on Capital Employed = Earnings Before Interest and Tax (EBIT) ÷ (Total Assets - Current Liabilities)
0.0043 = RM582k ÷ (RM198m - RM62m) (Based on the trailing twelve months to June 2021).
Therefore, Sinmah Capital Berhad has an ROCE of 0.4%. Ultimately, that's a low return and it under-performs the Food industry average of 8.2%.
View our latest analysis for Sinmah Capital Berhad
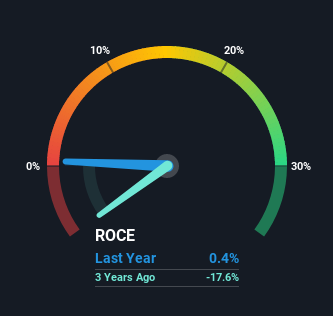
Historical performance is a great place to start when researching a stock so above you can see the gauge for Sinmah Capital Berhad's ROCE against it's prior returns. If you'd like to look at how Sinmah Capital Berhad has performed in the past in other metrics, you can view this free graph of past earnings, revenue and cash flow.
What Can We Tell From Sinmah Capital Berhad's ROCE Trend?
On the surface, the trend of ROCE at Sinmah Capital Berhad doesn't inspire confidence. To be more specific, ROCE has fallen from 4.5% over the last five years. Given the business is employing more capital while revenue has slipped, this is a bit concerning. This could mean that the business is losing its competitive advantage or market share, because while more money is being put into ventures, it's actually producing a lower return - "less bang for their buck" per se.
On a side note, Sinmah Capital Berhad has done well to pay down its current liabilities to 31% of total assets. So we could link some of this to the decrease in ROCE. What's more, this can reduce some aspects of risk to the business because now the company's suppliers or short-term creditors are funding less of its operations. Some would claim this reduces the business' efficiency at generating ROCE since it is now funding more of the operations with its own money.
The Bottom Line On Sinmah Capital Berhad's ROCE
In summary, we're somewhat concerned by Sinmah Capital Berhad's diminishing returns on increasing amounts of capital. Investors haven't taken kindly to these developments, since the stock has declined 43% from where it was five years ago. With underlying trends that aren't great in these areas, we'd consider looking elsewhere.
Sinmah Capital Berhad does come with some risks though, we found 4 warning signs in our investment analysis, and 2 of those are potentially serious...
If you want to search for solid companies with great earnings, check out this free list of companies with good balance sheets and impressive returns on equity.
When trading stocks or any other investment, use the platform considered by many to be the Professional's Gateway to the Worlds Market, Interactive Brokers. You get the lowest-cost* trading on stocks, options, futures, forex, bonds and funds worldwide from a single integrated account. Promoted
New: Manage All Your Stock Portfolios in One Place
We've created the ultimate portfolio companion for stock investors, and it's free.
• Connect an unlimited number of Portfolios and see your total in one currency
• Be alerted to new Warning Signs or Risks via email or mobile
• Track the Fair Value of your stocks
This article by Simply Wall St is general in nature. We provide commentary based on historical data and analyst forecasts only using an unbiased methodology and our articles are not intended to be financial advice. It does not constitute a recommendation to buy or sell any stock, and does not take account of your objectives, or your financial situation. We aim to bring you long-term focused analysis driven by fundamental data. Note that our analysis may not factor in the latest price-sensitive company announcements or qualitative material. Simply Wall St has no position in any stocks mentioned.
*Interactive Brokers Rated Lowest Cost Broker by StockBrokers.com Annual Online Review 2020
Have feedback on this article? Concerned about the content? Get in touch with us directly. Alternatively, email editorial-team (at) simplywallst.com.
About KLSE:SMCAP
Sinmah Capital Berhad
An investment holding company, engages in the property development business in Malaysia.
Flawless balance sheet slight.
Market Insights

Advertisement
Community Narratives
RIO is poised to weather a depressed iron ore environment, but commodity diversification comes with lower margins
Fair Value AU$110.51|4.0% overvalued
DU
Community Contributor
The demand for personalized medicine will keep Thermo Fisher Scientific thriving
Fair Value US$540.27|21.5% undervalued
UN
Community Contributor
Silver Play by A Family with 10x Potential
Fair Value UK£24.00|88.8% undervalued
RO
Community Contributor