
Advertisement
Some Shareholders Feeling Restless Over Sinmah Capital Berhad's (KLSE:SMCAP) P/S Ratio

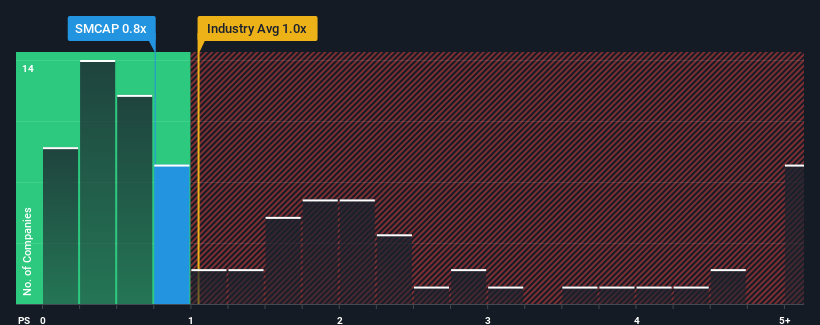
With a median price-to-sales (or "P/S") ratio of close to 1x in the Food industry in Malaysia, you could be forgiven for feeling indifferent about Sinmah Capital Berhad's (KLSE:SMCAP) P/S ratio of 0.8x. While this might not raise any eyebrows, if the P/S ratio is not justified investors could be missing out on a potential opportunity or ignoring looming disappointment.
See our latest analysis for Sinmah Capital Berhad
How Has Sinmah Capital Berhad Performed Recently?
For example, consider that Sinmah Capital Berhad's financial performance has been poor lately as its revenue has been in decline. Perhaps investors believe the recent revenue performance is enough to keep in line with the industry, which is keeping the P/S from dropping off. If you like the company, you'd at least be hoping this is the case so that you could potentially pick up some stock while it's not quite in favour.
Want the full picture on earnings, revenue and cash flow for the company? Then our free report on Sinmah Capital Berhad will help you shine a light on its historical performance.What Are Revenue Growth Metrics Telling Us About The P/S?
There's an inherent assumption that a company should be matching the industry for P/S ratios like Sinmah Capital Berhad's to be considered reasonable.
Taking a look back first, the company's revenue growth last year wasn't something to get excited about as it posted a disappointing decline of 60%. The last three years don't look nice either as the company has shrunk revenue by 70% in aggregate. So unfortunately, we have to acknowledge that the company has not done a great job of growing revenue over that time.
This is in contrast to the rest of the industry, which is expected to decline by 2.8% over the next year, or less than the company's recent medium-term annualised revenue decline.
In light of this, it's somewhat peculiar that Sinmah Capital Berhad's P/S sits in line with the majority of other companies. In general, when revenue shrink rapidly the P/S often shrinks too, which could set up shareholders for future disappointment. There's potential for the P/S to fall to lower levels if the company doesn't improve its top-line growth, which would be difficult to do with the current industry outlook.
What We Can Learn From Sinmah Capital Berhad's P/S?
Generally, our preference is to limit the use of the price-to-sales ratio to establishing what the market thinks about the overall health of a company.
We've established that Sinmah Capital Berhad currently trades on a higher than expected P/S since its recent three-year revenues are even worse than the forecasts for a struggling industry. Right now we are uncomfortable with the P/S as this revenue performance isn't likely to support a more positive sentiment for long. In addition, we would be concerned whether the company can even maintain its medium-term level of performance under these tough industry conditions. Unless the company's relative performance improves, it's challenging to accept these prices as being reasonable.
Having said that, be aware Sinmah Capital Berhad is showing 4 warning signs in our investment analysis, and 2 of those are significant.
If strong companies turning a profit tickle your fancy, then you'll want to check out this free list of interesting companies that trade on a low P/E (but have proven they can grow earnings).
New: Manage All Your Stock Portfolios in One Place
We've created the ultimate portfolio companion for stock investors, and it's free.
• Connect an unlimited number of Portfolios and see your total in one currency
• Be alerted to new Warning Signs or Risks via email or mobile
• Track the Fair Value of your stocks
Have feedback on this article? Concerned about the content? Get in touch with us directly. Alternatively, email editorial-team (at) simplywallst.com.
This article by Simply Wall St is general in nature. We provide commentary based on historical data and analyst forecasts only using an unbiased methodology and our articles are not intended to be financial advice. It does not constitute a recommendation to buy or sell any stock, and does not take account of your objectives, or your financial situation. We aim to bring you long-term focused analysis driven by fundamental data. Note that our analysis may not factor in the latest price-sensitive company announcements or qualitative material. Simply Wall St has no position in any stocks mentioned.
About KLSE:SMCAP
Sinmah Capital Berhad
An investment holding company, engages in the property development business in Malaysia.
Flawless balance sheet slight.
Market Insights

Advertisement
Community Narratives
RIO is poised to weather a depressed iron ore environment, but commodity diversification comes with lower margins
Fair Value AU$110.51|4.0% overvalued
DU
Community Contributor
The demand for personalized medicine will keep Thermo Fisher Scientific thriving
Fair Value US$540.27|21.5% undervalued
UN
Community Contributor
Silver Play by A Family with 10x Potential
Fair Value UK£24.00|88.8% undervalued
RO
Community Contributor