

Howard Marks put it nicely when he said that, rather than worrying about share price volatility, 'The possibility of permanent loss is the risk I worry about... and every practical investor I know worries about.' So it might be obvious that you need to consider debt, when you think about how risky any given stock is, because too much debt can sink a company. As with many other companies Astral Asia Berhad (KLSE:AASIA) makes use of debt. But the more important question is: how much risk is that debt creating?
When Is Debt Dangerous?
Generally speaking, debt only becomes a real problem when a company can't easily pay it off, either by raising capital or with its own cash flow. Part and parcel of capitalism is the process of 'creative destruction' where failed businesses are mercilessly liquidated by their bankers. However, a more frequent (but still costly) occurrence is where a company must issue shares at bargain-basement prices, permanently diluting shareholders, just to shore up its balance sheet. By replacing dilution, though, debt can be an extremely good tool for businesses that need capital to invest in growth at high rates of return. When we think about a company's use of debt, we first look at cash and debt together.
View our latest analysis for Astral Asia Berhad
What Is Astral Asia Berhad's Net Debt?
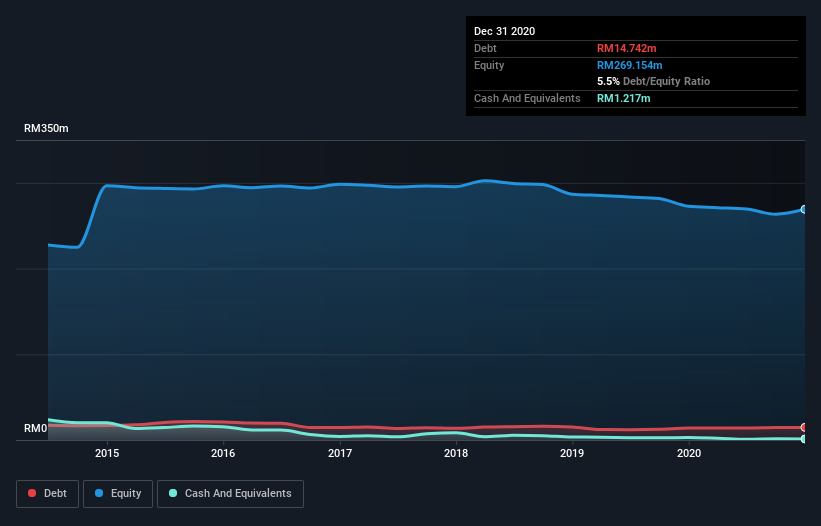
The image below, which you can click on for greater detail, shows that at December 2020 Astral Asia Berhad had debt of RM14.7m, up from RM13.9m in one year. However, because it has a cash reserve of RM1.22m, its net debt is less, at about RM13.5m.
How Strong Is Astral Asia Berhad's Balance Sheet?
We can see from the most recent balance sheet that Astral Asia Berhad had liabilities of RM11.0m falling due within a year, and liabilities of RM88.9m due beyond that. Offsetting these obligations, it had cash of RM1.22m as well as receivables valued at RM12.3m due within 12 months. So it has liabilities totalling RM86.5m more than its cash and near-term receivables, combined.
This is a mountain of leverage relative to its market capitalization of RM89.1m. Should its lenders demand that it shore up the balance sheet, shareholders would likely face severe dilution. The balance sheet is clearly the area to focus on when you are analysing debt. But it is Astral Asia Berhad's earnings that will influence how the balance sheet holds up in the future. So if you're keen to discover more about its earnings, it might be worth checking out this graph of its long term earnings trend.
Over 12 months, Astral Asia Berhad reported revenue of RM18m, which is a gain of 9.5%, although it did not report any earnings before interest and tax. We usually like to see faster growth from unprofitable companies, but each to their own.
Caveat Emptor
Over the last twelve months Astral Asia Berhad produced an earnings before interest and tax (EBIT) loss. Its EBIT loss was a whopping RM10m. Considering that alongside the liabilities mentioned above does not give us much confidence that company should be using so much debt. So we think its balance sheet is a little strained, though not beyond repair. However, it doesn't help that it burned through RM2.4m of cash over the last year. So suffice it to say we do consider the stock to be risky. There's no doubt that we learn most about debt from the balance sheet. However, not all investment risk resides within the balance sheet - far from it. Be aware that Astral Asia Berhad is showing 4 warning signs in our investment analysis , and 2 of those are a bit concerning...
At the end of the day, it's often better to focus on companies that are free from net debt. You can access our special list of such companies (all with a track record of profit growth). It's free.
If you decide to trade Astral Asia Berhad, use the lowest-cost* platform that is rated #1 Overall by Barron’s, Interactive Brokers. Trade stocks, options, futures, forex, bonds and funds on 135 markets, all from a single integrated account. Promoted
New: Manage All Your Stock Portfolios in One Place
We've created the ultimate portfolio companion for stock investors, and it's free.
• Connect an unlimited number of Portfolios and see your total in one currency
• Be alerted to new Warning Signs or Risks via email or mobile
• Track the Fair Value of your stocks
This article by Simply Wall St is general in nature. It does not constitute a recommendation to buy or sell any stock, and does not take account of your objectives, or your financial situation. We aim to bring you long-term focused analysis driven by fundamental data. Note that our analysis may not factor in the latest price-sensitive company announcements or qualitative material. Simply Wall St has no position in any stocks mentioned.
*Interactive Brokers Rated Lowest Cost Broker by StockBrokers.com Annual Online Review 2020
Have feedback on this article? Concerned about the content? Get in touch with us directly. Alternatively, email editorial-team (at) simplywallst.com.
About KLSE:AASIA
Astral Asia Berhad
An investment holding company, engages in the cultivation of oil palm in Malaysia.
Mediocre balance sheet low.
Market Insights

Community Narratives
