- Malaysia
- /
- Oil and Gas
- /
- KLSE:AVANGAAD
Investors Met With Slowing Returns on Capital At E.A. Technique (M) Berhad (KLSE:EATECH)

To find a multi-bagger stock, what are the underlying trends we should look for in a business? In a perfect world, we'd like to see a company investing more capital into its business and ideally the returns earned from that capital are also increasing. Basically this means that a company has profitable initiatives that it can continue to reinvest in, which is a trait of a compounding machine. So while E.A. Technique (M) Berhad (KLSE:EATECH) has a high ROCE right now, lets see what we can decipher from how returns are changing.
What Is Return On Capital Employed (ROCE)?
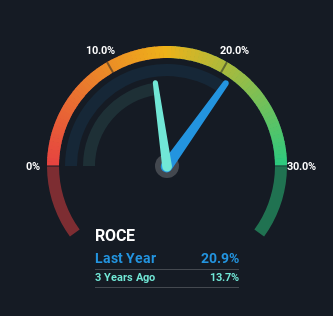
If you haven't worked with ROCE before, it measures the 'return' (pre-tax profit) a company generates from capital employed in its business. Analysts use this formula to calculate it for E.A. Technique (M) Berhad:
Return on Capital Employed = Earnings Before Interest and Tax (EBIT) ÷ (Total Assets - Current Liabilities)
0.21 = RM33m ÷ (RM507m - RM350m) (Based on the trailing twelve months to June 2023).
Thus, E.A. Technique (M) Berhad has an ROCE of 21%. In absolute terms that's a great return and it's even better than the Oil and Gas industry average of 14%.
View our latest analysis for E.A. Technique (M) Berhad
While the past is not representative of the future, it can be helpful to know how a company has performed historically, which is why we have this chart above. If you'd like to look at how E.A. Technique (M) Berhad has performed in the past in other metrics, you can view this free graph of past earnings, revenue and cash flow.
How Are Returns Trending?
Over the past five years, E.A. Technique (M) Berhad's ROCE has remained relatively flat while the business is using 70% less capital than before. When a company effectively decreases its assets base, it's not usually a sign to be optimistic on that company. However, the business's operational efficiency is still impressive considering the ROCE is high in absolute terms.
On another note, while the change in ROCE trend might not scream for attention, it's interesting that the current liabilities have actually gone up over the last five years. This is intriguing because if current liabilities hadn't increased to 69% of total assets, this reported ROCE would probably be less than21% because total capital employed would be higher.The 21% ROCE could be even lower if current liabilities weren't 69% of total assets, because the the formula would show a larger base of total capital employed. So with current liabilities at such high levels, this effectively means the likes of suppliers or short-term creditors are funding a meaningful part of the business, which in some instances can bring some risks.
Our Take On E.A. Technique (M) Berhad's ROCE
Overall, we're not ecstatic to see E.A. Technique (M) Berhad reducing the amount of capital it employs in the business. And in the last five years, the stock has given away 13% so the market doesn't look too hopeful on these trends strengthening any time soon. In any case, the stock doesn't have these traits of a multi-bagger discussed above, so if that's what you're looking for, we think you'd have more luck elsewhere.
E.A. Technique (M) Berhad does have some risks, we noticed 4 warning signs (and 3 which don't sit too well with us) we think you should know about.
E.A. Technique (M) Berhad is not the only stock earning high returns. If you'd like to see more, check out our free list of companies earning high returns on equity with solid fundamentals.
The New Payments ETF Is Live on NASDAQ:
Money is moving to real-time rails, and a newly listed ETF now gives investors direct exposure. Fast settlement. Institutional custody. Simple access.
Explore how this launch could reshape portfolios
Sponsored ContentNew: Manage All Your Stock Portfolios in One Place
We've created the ultimate portfolio companion for stock investors, and it's free.
• Connect an unlimited number of Portfolios and see your total in one currency
• Be alerted to new Warning Signs or Risks via email or mobile
• Track the Fair Value of your stocks
Have feedback on this article? Concerned about the content? Get in touch with us directly. Alternatively, email editorial-team (at) simplywallst.com.
This article by Simply Wall St is general in nature. We provide commentary based on historical data and analyst forecasts only using an unbiased methodology and our articles are not intended to be financial advice. It does not constitute a recommendation to buy or sell any stock, and does not take account of your objectives, or your financial situation. We aim to bring you long-term focused analysis driven by fundamental data. Note that our analysis may not factor in the latest price-sensitive company announcements or qualitative material. Simply Wall St has no position in any stocks mentioned.
About KLSE:AVANGAAD
Avangaad Berhad
Owns and operates marine vessels for the transportation and offshore storage of oil and gas in Malaysia.
Excellent balance sheet and good value.
Similar Companies
Market Insights

Weekly Picks

THE KINGDOM OF BROWN GOODS: WHY MGPI IS BEING CRUSHED BY INVENTORY & PRIMED FOR RESURRECTION


Why Vertical Aerospace (NYSE: EVTL) is Worth Possibly Over 13x its Current Price


The Quiet Giant That Became AI’s Power Grid
Recently Updated Narratives

Butler National (Buks) outperforms.


A tech powerhouse quietly powering the world’s AI infrastructure.


Keppel DC REIT (SGX: AJBU) is a resilient gem in the data center space.
Popular Narratives

MicroVision will explode future revenue by 380.37% with a vision towards success


Crazy Undervalued 42 Baggers Silver Play (Active & Running Mine)


