- Malaysia
- /
- Consumer Durables
- /
- KLSE:PANAMY
Panasonic Manufacturing Malaysia Berhad (KLSE:PANAMY) Has Compensated Shareholders With A Respectable 62% Return On Their Investment


When we invest, we're generally looking for stocks that outperform the market average. And the truth is, you can make significant gains if you buy good quality businesses at the right price. For example, long term Panasonic Manufacturing Malaysia Berhad (KLSE:PANAMY) shareholders have enjoyed a 26% share price rise over the last half decade, well in excess of the market decline of around 7.3% (not including dividends).
Check out our latest analysis for Panasonic Manufacturing Malaysia Berhad
To quote Buffett, 'Ships will sail around the world but the Flat Earth Society will flourish. There will continue to be wide discrepancies between price and value in the marketplace...' By comparing earnings per share (EPS) and share price changes over time, we can get a feel for how investor attitudes to a company have morphed over time.
During five years of share price growth, Panasonic Manufacturing Malaysia Berhad actually saw its EPS drop 4.6% per year.
With EPS falling, but a modestly increasing share price, it seems that the market was probably too pessimistic about the stock in the past. In the long term, though, it will be hard for the share price rises to continue without improving EPS.
The graphic below depicts how EPS has changed over time (unveil the exact values by clicking on the image).
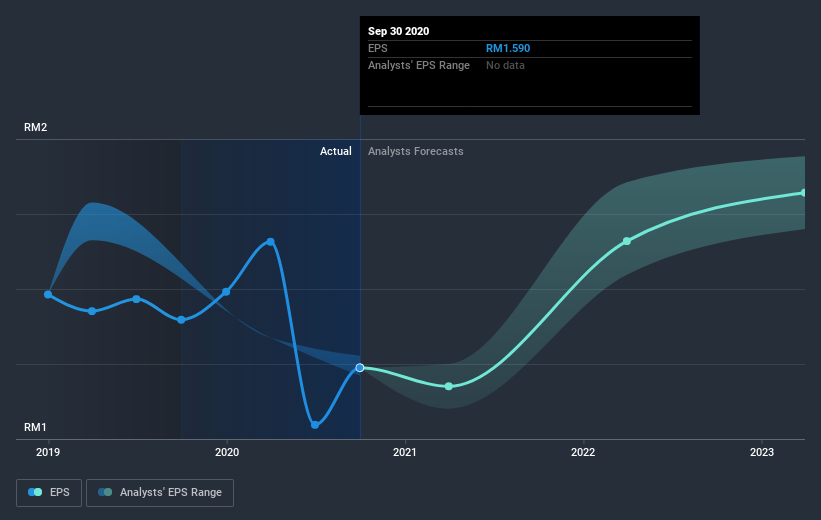
It might be well worthwhile taking a look at our free report on Panasonic Manufacturing Malaysia Berhad's earnings, revenue and cash flow.
What About Dividends?
It is important to consider the total shareholder return, as well as the share price return, for any given stock. Whereas the share price return only reflects the change in the share price, the TSR includes the value of dividends (assuming they were reinvested) and the benefit of any discounted capital raising or spin-off. It's fair to say that the TSR gives a more complete picture for stocks that pay a dividend. In the case of Panasonic Manufacturing Malaysia Berhad, it has a TSR of 62% for the last 5 years. That exceeds its share price return that we previously mentioned. The dividends paid by the company have thusly boosted the total shareholder return.
A Different Perspective
Investors in Panasonic Manufacturing Malaysia Berhad had a tough year, with a total loss of 11% (including dividends), against a market gain of about 5.8%. However, keep in mind that even the best stocks will sometimes underperform the market over a twelve month period. On the bright side, long term shareholders have made money, with a gain of 10% per year over half a decade. It could be that the recent sell-off is an opportunity, so it may be worth checking the fundamental data for signs of a long term growth trend. While it is well worth considering the different impacts that market conditions can have on the share price, there are other factors that are even more important. Even so, be aware that Panasonic Manufacturing Malaysia Berhad is showing 2 warning signs in our investment analysis , you should know about...
If you would prefer to check out another company -- one with potentially superior financials -- then do not miss this free list of companies that have proven they can grow earnings.
Please note, the market returns quoted in this article reflect the market weighted average returns of stocks that currently trade on MY exchanges.
When trading Panasonic Manufacturing Malaysia Berhad or any other investment, use the platform considered by many to be the Professional's Gateway to the Worlds Market, Interactive Brokers. You get the lowest-cost* trading on stocks, options, futures, forex, bonds and funds worldwide from a single integrated account. Promoted
New: Manage All Your Stock Portfolios in One Place
We've created the ultimate portfolio companion for stock investors, and it's free.
• Connect an unlimited number of Portfolios and see your total in one currency
• Be alerted to new Warning Signs or Risks via email or mobile
• Track the Fair Value of your stocks
This article by Simply Wall St is general in nature. It does not constitute a recommendation to buy or sell any stock, and does not take account of your objectives, or your financial situation. We aim to bring you long-term focused analysis driven by fundamental data. Note that our analysis may not factor in the latest price-sensitive company announcements or qualitative material. Simply Wall St has no position in any stocks mentioned.
*Interactive Brokers Rated Lowest Cost Broker by StockBrokers.com Annual Online Review 2020
Have feedback on this article? Concerned about the content? Get in touch with us directly. Alternatively, email editorial-team (at) simplywallst.com.
About KLSE:PANAMY
Panasonic Manufacturing Malaysia Berhad
Manufactures and sells electrical home appliances and related components under the Panasonic brand name in Malaysia, Japan, rest of Asia, Europe, the Middle East, and internationally.
Flawless balance sheet with moderate growth potential.
Market Insights

Community Narratives

