- Malaysia
- /
- Trade Distributors
- /
- KLSE:PASUKGB
A Piece Of The Puzzle Missing From Pasukhas Group Berhad's (KLSE:PASUKGB) 26% Share Price Climb


The Pasukhas Group Berhad (KLSE:PASUKGB) share price has done very well over the last month, posting an excellent gain of 26%. Unfortunately, the gains of the last month did little to right the losses of the last year with the stock still down 15% over that time.
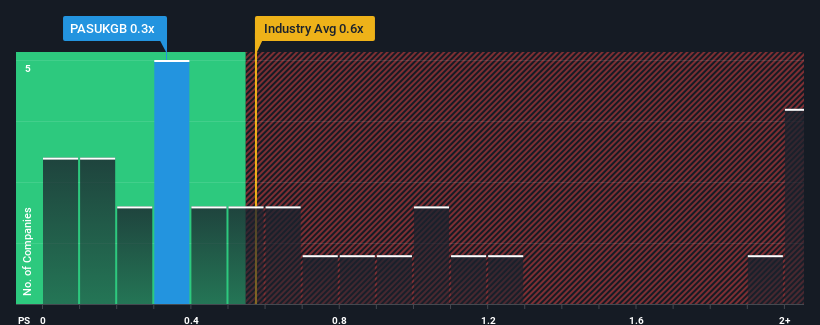
Although its price has surged higher, you could still be forgiven for feeling indifferent about Pasukhas Group Berhad's P/S ratio of 0.3x, since the median price-to-sales (or "P/S") ratio for the Trade Distributors industry in Malaysia is also close to 0.6x. Although, it's not wise to simply ignore the P/S without explanation as investors may be disregarding a distinct opportunity or a costly mistake.
View our latest analysis for Pasukhas Group Berhad
How Has Pasukhas Group Berhad Performed Recently?
Pasukhas Group Berhad has been doing a good job lately as it's been growing revenue at a solid pace. One possibility is that the P/S is moderate because investors think this respectable revenue growth might not be enough to outperform the broader industry in the near future. If you like the company, you'd be hoping this isn't the case so that you could potentially pick up some stock while it's not quite in favour.
We don't have analyst forecasts, but you can see how recent trends are setting up the company for the future by checking out our free report on Pasukhas Group Berhad's earnings, revenue and cash flow.Do Revenue Forecasts Match The P/S Ratio?
In order to justify its P/S ratio, Pasukhas Group Berhad would need to produce growth that's similar to the industry.
Taking a look back first, we see that the company grew revenue by an impressive 30% last year. The latest three year period has also seen an incredible overall rise in revenue, aided by its incredible short-term performance. So we can start by confirming that the company has done a tremendous job of growing revenue over that time.
Comparing that to the industry, which is only predicted to deliver 2.8% growth in the next 12 months, the company's momentum is stronger based on recent medium-term annualised revenue results.
In light of this, it's curious that Pasukhas Group Berhad's P/S sits in line with the majority of other companies. It may be that most investors are not convinced the company can maintain its recent growth rates.
What We Can Learn From Pasukhas Group Berhad's P/S?
Pasukhas Group Berhad's stock has a lot of momentum behind it lately, which has brought its P/S level with the rest of the industry. While the price-to-sales ratio shouldn't be the defining factor in whether you buy a stock or not, it's quite a capable barometer of revenue expectations.
We've established that Pasukhas Group Berhad currently trades on a lower than expected P/S since its recent three-year growth is higher than the wider industry forecast. It'd be fair to assume that potential risks the company faces could be the contributing factor to the lower than expected P/S. It appears some are indeed anticipating revenue instability, because the persistence of these recent medium-term conditions would normally provide a boost to the share price.
Having said that, be aware Pasukhas Group Berhad is showing 4 warning signs in our investment analysis, you should know about.
If companies with solid past earnings growth is up your alley, you may wish to see this free collection of other companies with strong earnings growth and low P/E ratios.
If you're looking to trade Pasukhas Group Berhad, open an account with the lowest-cost platform trusted by professionals, Interactive Brokers.
With clients in over 200 countries and territories, and access to 160 markets, IBKR lets you trade stocks, options, futures, forex, bonds and funds from a single integrated account.
Enjoy no hidden fees, no account minimums, and FX conversion rates as low as 0.03%, far better than what most brokers offer.
Sponsored ContentNew: Manage All Your Stock Portfolios in One Place
We've created the ultimate portfolio companion for stock investors, and it's free.
• Connect an unlimited number of Portfolios and see your total in one currency
• Be alerted to new Warning Signs or Risks via email or mobile
• Track the Fair Value of your stocks
Have feedback on this article? Concerned about the content? Get in touch with us directly. Alternatively, email editorial-team (at) simplywallst.com.
This article by Simply Wall St is general in nature. We provide commentary based on historical data and analyst forecasts only using an unbiased methodology and our articles are not intended to be financial advice. It does not constitute a recommendation to buy or sell any stock, and does not take account of your objectives, or your financial situation. We aim to bring you long-term focused analysis driven by fundamental data. Note that our analysis may not factor in the latest price-sensitive company announcements or qualitative material. Simply Wall St has no position in any stocks mentioned.
About KLSE:PASUKGB
Pasukhas Group Berhad
An investment holding company, operates as a civil, mechanical, and electrical company serving various market segments in Malaysia.
Flawless balance sheet low.
Similar Companies
Market Insights

Community Narratives
