
Advertisement
- Malaysia
- /
- Trade Distributors
- /
- KLSE:CHINHIN
After Leaping 39% Chin Hin Group Berhad (KLSE:CHINHIN) Shares Are Not Flying Under The Radar

Chin Hin Group Berhad (KLSE:CHINHIN) shares have continued their recent momentum with a 39% gain in the last month alone. Looking back a bit further, it's encouraging to see the stock is up 61% in the last year.
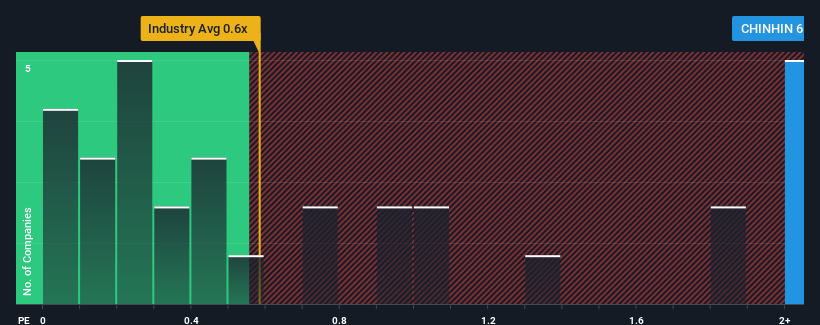
Since its price has surged higher, given around half the companies in Malaysia's Trade Distributors industry have price-to-sales ratios (or "P/S") below 0.6x, you may consider Chin Hin Group Berhad as a stock to avoid entirely with its 6x P/S ratio. Although, it's not wise to just take the P/S at face value as there may be an explanation why it's so lofty.
See our latest analysis for Chin Hin Group Berhad
How Has Chin Hin Group Berhad Performed Recently?
Revenue has risen firmly for Chin Hin Group Berhad recently, which is pleasing to see. One possibility is that the P/S ratio is high because investors think this respectable revenue growth will be enough to outperform the broader industry in the near future. If not, then existing shareholders may be a little nervous about the viability of the share price.
Although there are no analyst estimates available for Chin Hin Group Berhad, take a look at this free data-rich visualisation to see how the company stacks up on earnings, revenue and cash flow.Do Revenue Forecasts Match The High P/S Ratio?
In order to justify its P/S ratio, Chin Hin Group Berhad would need to produce outstanding growth that's well in excess of the industry.
Taking a look back first, we see that the company grew revenue by an impressive 26% last year. The latest three year period has also seen an excellent 112% overall rise in revenue, aided by its short-term performance. Therefore, it's fair to say the revenue growth recently has been superb for the company.
This is in contrast to the rest of the industry, which is expected to grow by 7.0% over the next year, materially lower than the company's recent medium-term annualised growth rates.
With this information, we can see why Chin Hin Group Berhad is trading at such a high P/S compared to the industry. Presumably shareholders aren't keen to offload something they believe will continue to outmanoeuvre the wider industry.
The Final Word
Shares in Chin Hin Group Berhad have seen a strong upwards swing lately, which has really helped boost its P/S figure. While the price-to-sales ratio shouldn't be the defining factor in whether you buy a stock or not, it's quite a capable barometer of revenue expectations.
As we suspected, our examination of Chin Hin Group Berhad revealed its three-year revenue trends are contributing to its high P/S, given they look better than current industry expectations. At this stage investors feel the potential continued revenue growth in the future is great enough to warrant an inflated P/S. Unless the recent medium-term conditions change, they will continue to provide strong support to the share price.
We don't want to rain on the parade too much, but we did also find 2 warning signs for Chin Hin Group Berhad (1 shouldn't be ignored!) that you need to be mindful of.
If strong companies turning a profit tickle your fancy, then you'll want to check out this free list of interesting companies that trade on a low P/E (but have proven they can grow earnings).
New: AI Stock Screener & Alerts
Our new AI Stock Screener scans the market every day to uncover opportunities.
• Dividend Powerhouses (3%+ Yield)
• Undervalued Small Caps with Insider Buying
• High growth Tech and AI Companies
Or build your own from over 50 metrics.
Have feedback on this article? Concerned about the content? Get in touch with us directly. Alternatively, email editorial-team (at) simplywallst.com.
This article by Simply Wall St is general in nature. We provide commentary based on historical data and analyst forecasts only using an unbiased methodology and our articles are not intended to be financial advice. It does not constitute a recommendation to buy or sell any stock, and does not take account of your objectives, or your financial situation. We aim to bring you long-term focused analysis driven by fundamental data. Note that our analysis may not factor in the latest price-sensitive company announcements or qualitative material. Simply Wall St has no position in any stocks mentioned.
About KLSE:CHINHIN
Adequate balance sheet low.
Similar Companies
Market Insights

Advertisement
Community Narratives

Apple: A Dying Star with an Overpriced Valuation
Fair Value US$177.34|17.7% overvalued
IN
Community Contributor
Avino a case for USD$20 per share within 5 years (assuming $3,500 gold, $100 silver and $4 copper).
Fair Value CA$26.79|86.0% undervalued
AG
Community Contributor
Riding the Defense Boom RENK Sees Revenue Climb at 15% CAGR by FY 2029
Fair Value €69.87|11.0% undervalued
CH
Community Contributor