
Advertisement
- Mexico
- /
- Real Estate
- /
- BMV:VESTA *
Corporación Inmobiliaria Vesta. de's (BMV:VESTA) earnings growth rate lags the 16% CAGR delivered to shareholders

Corporación Inmobiliaria Vesta, S.A.B. de C.V. (BMV:VESTA) shareholders have seen the share price descend 16% over the month. While that's not great, the returns over five years have been decent. The share price is up 70%, which is better than the market return of 67%. Unfortunately not all shareholders will have held it for the long term, so spare a thought for those caught in the 29% decline over the last twelve months.
Since the long term performance has been good but there's been a recent pullback of 8.3%, let's check if the fundamentals match the share price.
See our latest analysis for Corporación Inmobiliaria Vesta. de
While the efficient markets hypothesis continues to be taught by some, it has been proven that markets are over-reactive dynamic systems, and investors are not always rational. One flawed but reasonable way to assess how sentiment around a company has changed is to compare the earnings per share (EPS) with the share price.
During five years of share price growth, Corporación Inmobiliaria Vesta. de achieved compound earnings per share (EPS) growth of 3.3% per year. This EPS growth is lower than the 11% average annual increase in the share price. This suggests that market participants hold the company in higher regard, these days. And that's hardly shocking given the track record of growth.
You can see below how EPS has changed over time (discover the exact values by clicking on the image).
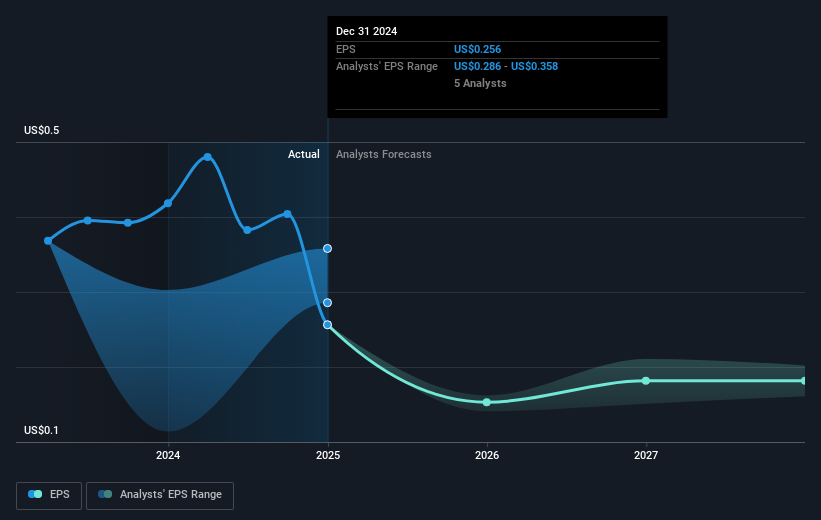
It might be well worthwhile taking a look at our free report on Corporación Inmobiliaria Vesta. de's earnings, revenue and cash flow.
What About Dividends?
As well as measuring the share price return, investors should also consider the total shareholder return (TSR). The TSR incorporates the value of any spin-offs or discounted capital raisings, along with any dividends, based on the assumption that the dividends are reinvested. Arguably, the TSR gives a more comprehensive picture of the return generated by a stock. As it happens, Corporación Inmobiliaria Vesta. de's TSR for the last 5 years was 107%, which exceeds the share price return mentioned earlier. This is largely a result of its dividend payments!
A Different Perspective
While the broader market lost about 7.5% in the twelve months, Corporación Inmobiliaria Vesta. de shareholders did even worse, losing 27% (even including dividends). However, it could simply be that the share price has been impacted by broader market jitters. It might be worth keeping an eye on the fundamentals, in case there's a good opportunity. On the bright side, long term shareholders have made money, with a gain of 16% per year over half a decade. It could be that the recent sell-off is an opportunity, so it may be worth checking the fundamental data for signs of a long term growth trend. It's always interesting to track share price performance over the longer term. But to understand Corporación Inmobiliaria Vesta. de better, we need to consider many other factors. For instance, we've identified 3 warning signs for Corporación Inmobiliaria Vesta. de (1 can't be ignored) that you should be aware of.
Of course Corporación Inmobiliaria Vesta. de may not be the best stock to buy. So you may wish to see this free collection of growth stocks.
Please note, the market returns quoted in this article reflect the market weighted average returns of stocks that currently trade on Mexican exchanges.
New: AI Stock Screener & Alerts
Our new AI Stock Screener scans the market every day to uncover opportunities.
• Dividend Powerhouses (3%+ Yield)
• Undervalued Small Caps with Insider Buying
• High growth Tech and AI Companies
Or build your own from over 50 metrics.
Have feedback on this article? Concerned about the content? Get in touch with us directly. Alternatively, email editorial-team (at) simplywallst.com.
This article by Simply Wall St is general in nature. We provide commentary based on historical data and analyst forecasts only using an unbiased methodology and our articles are not intended to be financial advice. It does not constitute a recommendation to buy or sell any stock, and does not take account of your objectives, or your financial situation. We aim to bring you long-term focused analysis driven by fundamental data. Note that our analysis may not factor in the latest price-sensitive company announcements or qualitative material. Simply Wall St has no position in any stocks mentioned.
About BMV:VESTA *
Corporación Inmobiliaria Vesta. de
Acquires, develops, manages, operates, and leases industrial buildings and distribution facilities in Mexico.
Established dividend payer with adequate balance sheet.
Similar Companies
Market Insights

Advertisement
Community Narratives
Pinterest will surge as advertising innovations ignite revenue growth
Fair Value US$42.63|26.1% undervalued
BR
Community Contributor
Brambles' Revenue Set to Climb 14% with Profit Margins Following
Fair Value AU$21.90|4.8% overvalued
RO
Community Contributor
Challenging Future for STG as Organic Sales Decline by 8.8%
Fair Value DKK 116.13|27.0% undervalued
KA
Community Contributor