Advertisement
- Luxembourg
- /
- Real Estate
- /
- BDL:ORCL
Should Investors Reassess CPI FIM as Shares Slide 9.5% in June 2025?

Simply Wall St
Reviewed by Bailey Pemberton
If you are weighing your next move on CPI FIM, you are certainly not alone. With a track record that has left investors both impressed and curious, the stock continues to stir up questions about whether the best is yet to come. Over the past year, CPI FIM has delivered a whopping 46.2% return, adding to an exceptional 331.8% gain across five years. While the past month's slide of -9.5% and a flat performance over the last week might make some pause, it is important to see these ups and downs in the context of recent broader market shifts and changing risk perceptions, particularly as investors recalibrate after a period of persistent gains.
Even after recent market jitters, the company's performance year-to-date remains up 13.1%. This combination of long-term growth and short-term volatility often signals shifting expectations, sometimes driven by sector-wide trends or global economic developments, as has been the case lately. All of this sets the stage for a deeper look at value: CPI FIM currently racks up a valuation score of 4 out of 6, meaning it is considered undervalued in four of the six key metrics analysts typically monitor.
With that in mind, the real question becomes how do these valuation checks stack up, and what could they be missing? Let us break down the valuation methods most investors turn to, before uncovering what may be the smartest way to judge if CPI FIM is truly a buy right now.
CPI FIM delivered 46.2% returns over the last year. See how this stacks up to the rest of the Real Estate industry.Approach 1: CPI FIM Discounted Cash Flow (DCF) Analysis
The Discounted Cash Flow (DCF) model calculates a company’s worth by projecting its free cash flow into the future and then discounting those estimated cash flows back to today’s value. This approach aims to assess the intrinsic value of a business based on its underlying cash generating ability over time, rather than just current profits or market sentiment.
For CPI FIM, the most recent twelve months produced free cash flow of €190.5 Million. Analysts forecast continued growth over the coming years, with projections suggesting free cash flow could reach roughly €439.7 Million by 2035. The annual growth rates for these projections gradually taper over time, starting at 21.10% in 2026 and declining to around 3.72% by 2035. Notably, longer-term projections beyond five years are extrapolations based on prior analyst input.
Running all of these forecasts through the 2 Stage Free Cash Flow to Equity DCF model, the estimated intrinsic value per share is €2.84. Compared to the current share price, this suggests CPI FIM is trading at a 66.6% discount. This indicates the stock could be substantially undervalued based on its future cash-generating potential.
Result: UNDERVALUED
Head to the Valuation section of our Company Report for more details on how we arrive at this Fair Value for CPI FIM.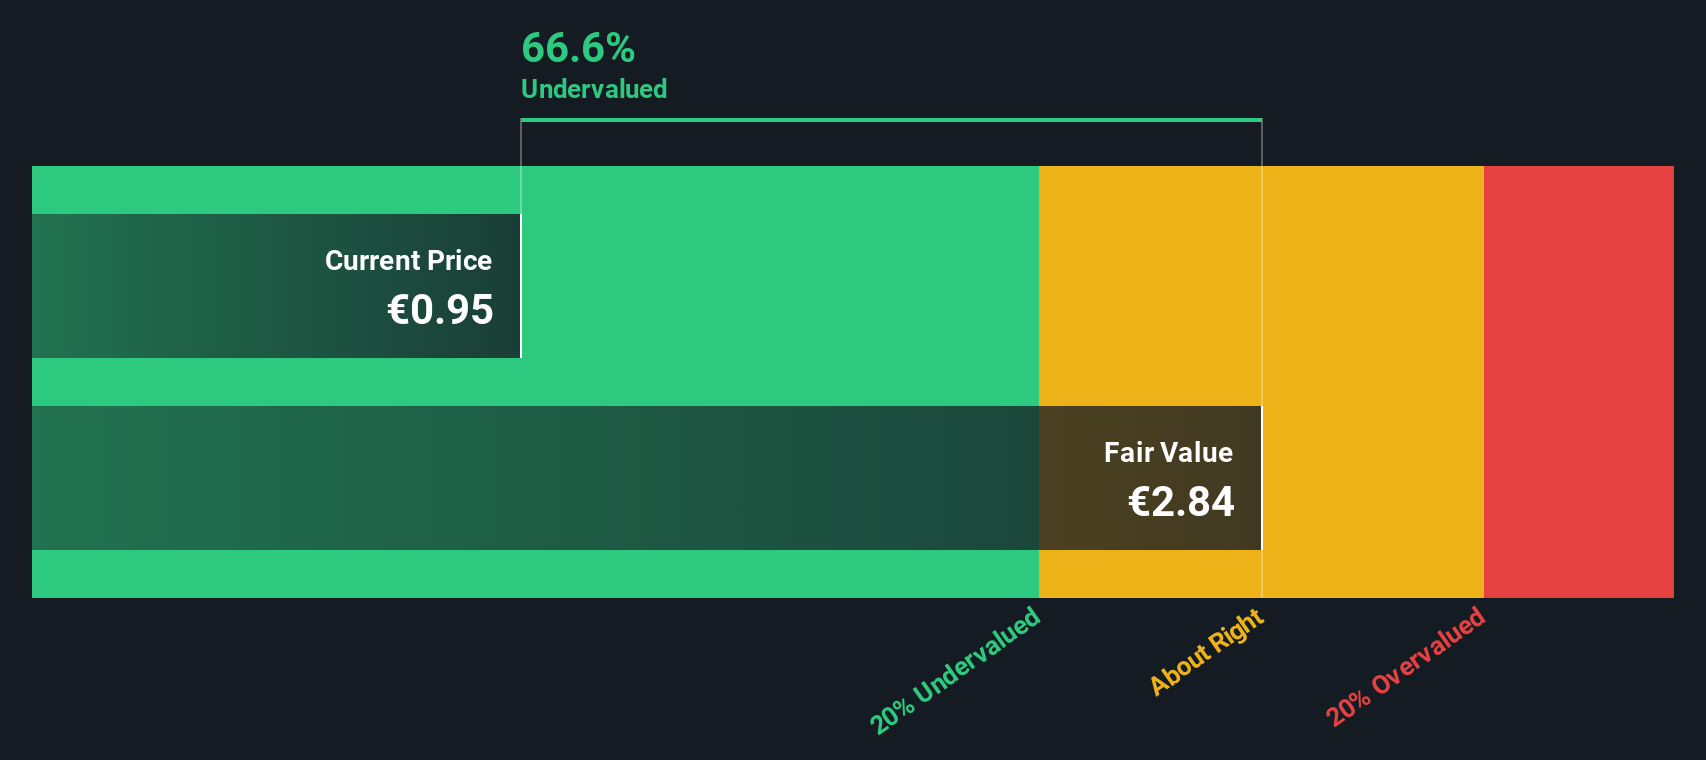
Approach 2: CPI FIM Price vs Earnings
The Price-to-Earnings (PE) ratio is widely used when evaluating profitable companies such as CPI FIM, as it directly relates a company’s share price to its earnings per share. This makes it a useful shorthand for considering how much the market values each euro of current profit.
Generally, investors expect companies with higher growth prospects and lower risk to trade at higher PE ratios. Riskier or slower-growing firms typically garner lower multiples. External factors, such as profit margin sustainability and sector trends, also impact what is considered a "normal" PE for a given stock.
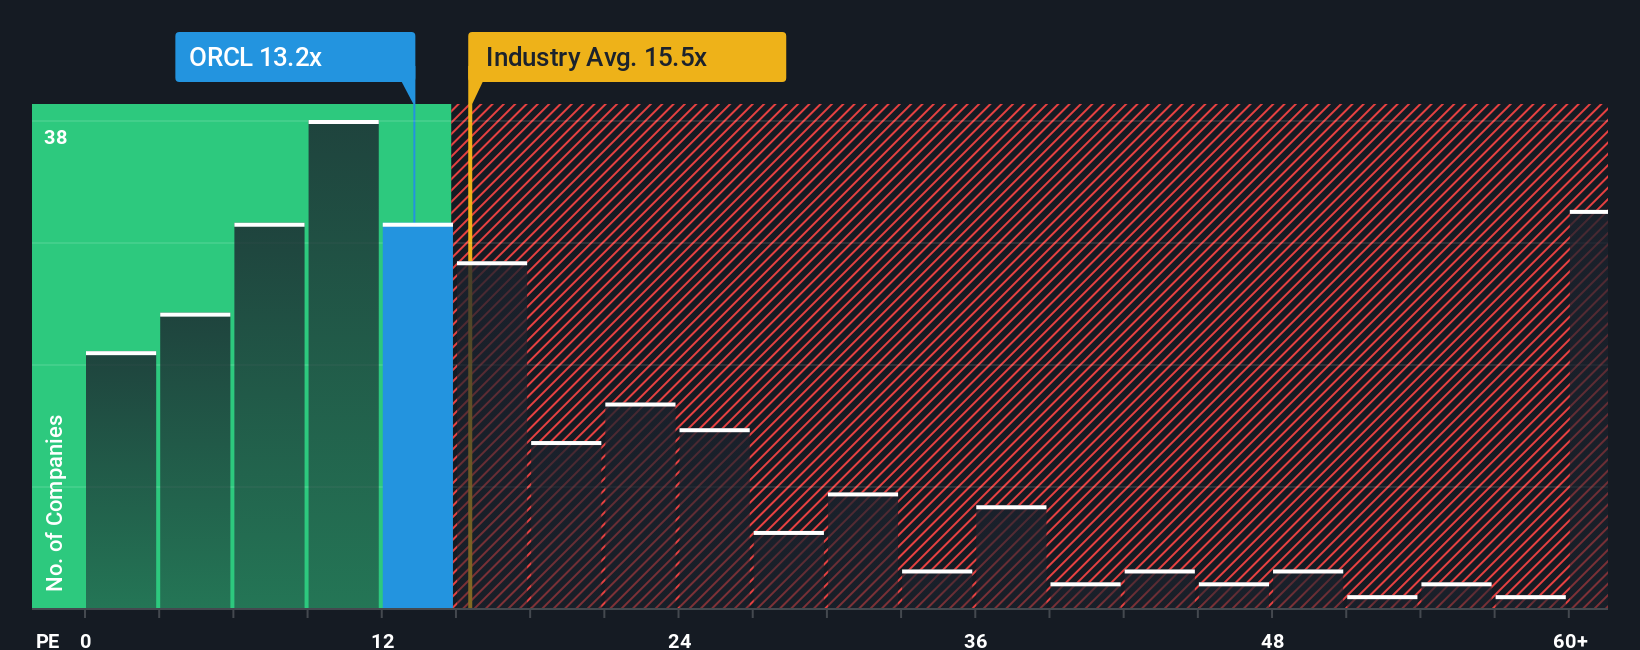
CPI FIM currently trades at a PE ratio of 13.2x. This is below the Real Estate industry average of 15.5x and significantly lower than the peer average of 21.6x. This suggests the market is pricing CPI FIM’s earnings more conservatively than many of its competitors.
Simply Wall St's proprietary "Fair Ratio" looks beyond basic industry comparisons by incorporating sector context as well as factors like the company's unique earnings growth profile, profit margins, business risks, and market capitalization. This produces a tailored benchmark for what CPI FIM’s multiple should be.
When contrasting this Fair Ratio with CPI FIM’s present PE, the difference is minimal. This signals that the stock’s valuation is in line with its fundamentals given its growth and risk profile.
Result: ABOUT RIGHT
Upgrade Your Decision Making: Choose your CPI FIM Narrative
Earlier we mentioned that there is an even better way to understand valuation, so let us introduce you to Narratives. A Narrative connects your perspective on a company, such as CPI FIM's competitive strengths or risks, to a full financial forecast, then links that story directly to a fair value estimate.
This approach makes investing personal and interactive. Narratives are incredibly easy to use and are available to everyone through the Simply Wall St Community page, where millions of investors share their views. Instead of just crunching numbers, Narratives help you decide exactly when to buy or sell by constantly comparing your chosen Fair Value against the latest price.
The best part is, Narratives update automatically whenever fresh information, such as earnings or breaking news, emerges, ensuring your analysis is always up to date. For example, one investor’s Narrative for CPI FIM could be highly optimistic, forecasting significant growth, while another might be more cautious with a lower fair value, reflecting concerns about market trends or risk. This flexibility lets every investor tailor their approach with confidence and clarity.
Do you think there's more to the story for CPI FIM? Create your own Narrative to let the Community know!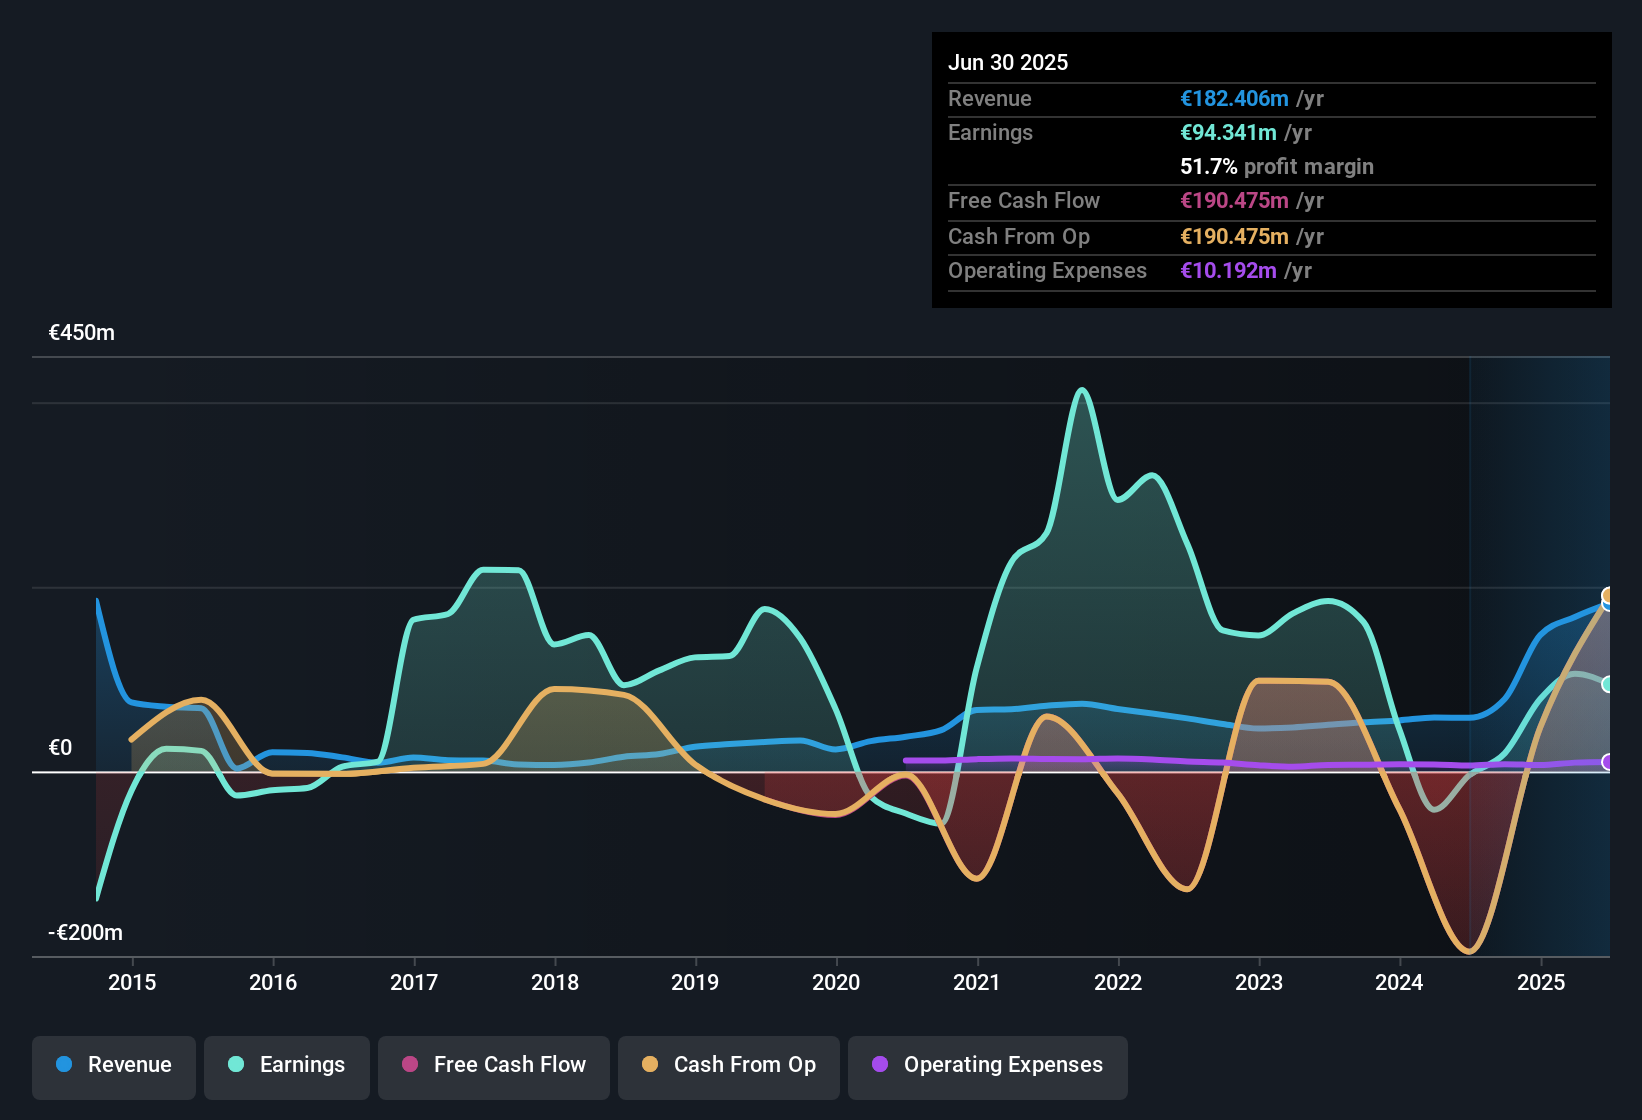
This article by Simply Wall St is general in nature. We provide commentary based on historical data and analyst forecasts only using an unbiased methodology and our articles are not intended to be financial advice. It does not constitute a recommendation to buy or sell any stock, and does not take account of your objectives, or your financial situation. We aim to bring you long-term focused analysis driven by fundamental data. Note that our analysis may not factor in the latest price-sensitive company announcements or qualitative material. Simply Wall St has no position in any stocks mentioned.
New: AI Stock Screener & Alerts
Our new AI Stock Screener scans the market every day to uncover opportunities.
• Dividend Powerhouses (3%+ Yield)
• Undervalued Small Caps with Insider Buying
• High growth Tech and AI Companies
Or build your own from over 50 metrics.
Have feedback on this article? Concerned about the content? Get in touch with us directly. Alternatively, email editorial-team@simplywallst.com
About BDL:ORCL
CPI FIM
CPI FIM SA, société anonyme (the “Company”) and its subsidiaries (together the “Group” or “CPI FIM”), is an owner of income-generating real estate and land bank primarily in Poland and in the Czech Republic.
Good value with acceptable track record.
Market Insights


Advertisement
Community Narratives
America Wants Homegrown Drones — Draganfly Is Ready to Deliver
Fair Value US$9.21|27.4% undervalued
JO
Community Contributor
Cheesecake Factory offers an enticing opportunity for long-term growth by leveraging new concepts
Fair Value US$73.83|25.8% undervalued
ZW
Community Contributor
Coca-Cola’s Intrinsic Value Set to Rise with Fed Rate Cut
Fair Value US$67.50|2.7% undervalued
AL
Community Contributor
Fully Permitted Gold Mine with 50 Baggers Potential 
Fair Value CA$41.00|98.0% undervalued
RO
Community Contributor