- South Korea
- /
- Renewable Energy
- /
- KOSDAQ:A389260
Daemyoung Energy Co.,Ltd's (KOSDAQ:389260) 26% Dip Still Leaving Some Shareholders Feeling Restless Over Its P/SRatio
Daemyoung Energy Co.,Ltd (KOSDAQ:389260) shareholders that were waiting for something to happen have been dealt a blow with a 26% share price drop in the last month. Instead of being rewarded, shareholders who have already held through the last twelve months are now sitting on a 33% share price drop.
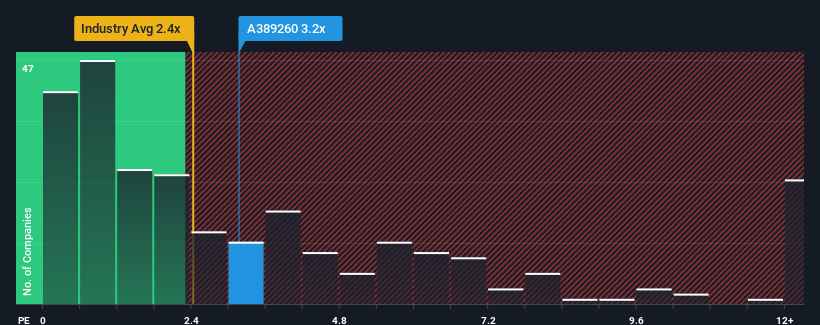
In spite of the heavy fall in price, given close to half the companies operating in Korea's Renewable Energy industry have price-to-sales ratios (or "P/S") below 2.4x, you may still consider Daemyoung EnergyLtd as a stock to potentially avoid with its 3.2x P/S ratio. Although, it's not wise to just take the P/S at face value as there may be an explanation why it's as high as it is.
Check out our latest analysis for Daemyoung EnergyLtd

How Has Daemyoung EnergyLtd Performed Recently?
While the industry has experienced revenue growth lately, Daemyoung EnergyLtd's revenue has gone into reverse gear, which is not great. Perhaps the market is expecting the poor revenue to reverse, justifying it's current high P/S.. If not, then existing shareholders may be extremely nervous about the viability of the share price.
If you'd like to see what analysts are forecasting going forward, you should check out our free report on Daemyoung EnergyLtd.What Are Revenue Growth Metrics Telling Us About The High P/S?
There's an inherent assumption that a company should outperform the industry for P/S ratios like Daemyoung EnergyLtd's to be considered reasonable.
Taking a look back first, the company's revenue growth last year wasn't something to get excited about as it posted a disappointing decline of 36%. The last three years don't look nice either as the company has shrunk revenue by 60% in aggregate. So unfortunately, we have to acknowledge that the company has not done a great job of growing revenue over that time.
Shifting to the future, estimates from the one analyst covering the company suggest revenue growth is heading into negative territory, declining 100% over the next year. With the industry predicted to deliver 15% growth, that's a disappointing outcome.
With this information, we find it concerning that Daemyoung EnergyLtd is trading at a P/S higher than the industry. It seems most investors are hoping for a turnaround in the company's business prospects, but the analyst cohort is not so confident this will happen. There's a very good chance these shareholders are setting themselves up for future disappointment if the P/S falls to levels more in line with the negative growth outlook.
The Bottom Line On Daemyoung EnergyLtd's P/S
Daemyoung EnergyLtd's P/S remain high even after its stock plunged. Using the price-to-sales ratio alone to determine if you should sell your stock isn't sensible, however it can be a practical guide to the company's future prospects.
We've established that Daemyoung EnergyLtd currently trades on a much higher than expected P/S for a company whose revenues are forecast to decline. In cases like this where we see revenue decline on the horizon, we suspect the share price is at risk of following suit, bringing back the high P/S into the realms of suitability. Unless these conditions improve markedly, it'll be a challenging time for shareholders.
Don't forget that there may be other risks. For instance, we've identified 4 warning signs for Daemyoung EnergyLtd (2 are potentially serious) you should be aware of.
If these risks are making you reconsider your opinion on Daemyoung EnergyLtd, explore our interactive list of high quality stocks to get an idea of what else is out there.
New: Manage All Your Stock Portfolios in One Place
We've created the ultimate portfolio companion for stock investors, and it's free.
• Connect an unlimited number of Portfolios and see your total in one currency
• Be alerted to new Warning Signs or Risks via email or mobile
• Track the Fair Value of your stocks
Have feedback on this article? Concerned about the content? Get in touch with us directly. Alternatively, email editorial-team (at) simplywallst.com.
This article by Simply Wall St is general in nature. We provide commentary based on historical data and analyst forecasts only using an unbiased methodology and our articles are not intended to be financial advice. It does not constitute a recommendation to buy or sell any stock, and does not take account of your objectives, or your financial situation. We aim to bring you long-term focused analysis driven by fundamental data. Note that our analysis may not factor in the latest price-sensitive company announcements or qualitative material. Simply Wall St has no position in any stocks mentioned.
About KOSDAQ:A389260
Daemyoung EnergyLtd
Operates renewable energy power plants in South Korea.
Mediocre balance sheet with low risk.
Market Insights
Weekly Picks


Crazy Undervalued 42 Baggers Silver Play (Active & Running Mine)


Fiducian: Compliance Clouds or Value Opportunity?

Willamette Valley Vineyards (WVVI): Not-So-Great Value
Recently Updated Narratives

Significantly undervalued gold explorer in Timmins, finally getting traction

Moderation and Stabilisation: HOLD: Fair Price based on a 4-year Cycle is $12.08


Positioned globally, partnered locally
Popular Narratives


MicroVision will explode future revenue by 380.37% with a vision towards success


NVDA: Expanding AI Demand Will Drive Major Data Center Investments Through 2026


