- South Korea
- /
- Telecom Services and Carriers
- /
- KOSDAQ:A036630
Even after rising 14% this past week, Sejong Telecom (KOSDAQ:036630) shareholders are still down 56% over the past three years


Over the last month the Sejong Telecom, Inc. (KOSDAQ:036630) has been much stronger than before, rebounding by 63%. But that doesn't change the fact that the returns over the last three years have been disappointing. Tragically, the share price declined 56% in that time. So the improvement may be a real relief to some. After all, could be that the fall was overdone.
On a more encouraging note the company has added ₩10.0b to its market cap in just the last 7 days, so let's see if we can determine what's driven the three-year loss for shareholders.
We've discovered 3 warning signs about Sejong Telecom. View them for free.Sejong Telecom wasn't profitable in the last twelve months, it is unlikely we'll see a strong correlation between its share price and its earnings per share (EPS). Arguably revenue is our next best option. Generally speaking, companies without profits are expected to grow revenue every year, and at a good clip. Some companies are willing to postpone profitability to grow revenue faster, but in that case one would hope for good top-line growth to make up for the lack of earnings.
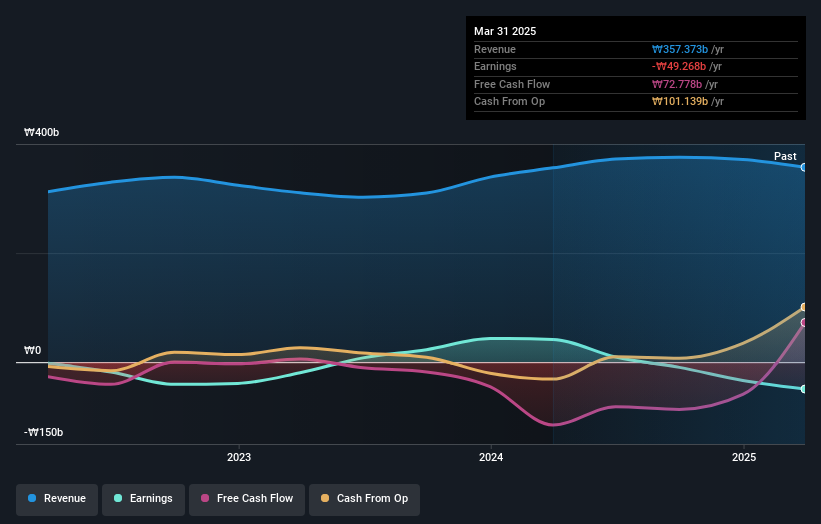
Over three years, Sejong Telecom grew revenue at 5.8% per year. Given it's losing money in pursuit of growth, we are not really impressed with that. This uninspiring revenue growth has no doubt helped send the share price lower; it dropped 16% during the period. It can be well worth keeping an eye on growth stocks that disappoint the market, because sometimes they re-accelerate. After all, growing a business isn't easy, and the process will not always be smooth.
The graphic below depicts how earnings and revenue have changed over time (unveil the exact values by clicking on the image).
Balance sheet strength is crucial. It might be well worthwhile taking a look at our free report on how its financial position has changed over time.
A Different Perspective
While the broader market lost about 5.2% in the twelve months, Sejong Telecom shareholders did even worse, losing 29% (even including dividends). However, it could simply be that the share price has been impacted by broader market jitters. It might be worth keeping an eye on the fundamentals, in case there's a good opportunity. Unfortunately, last year's performance may indicate unresolved challenges, given that it was worse than the annualised loss of 6% over the last half decade. Generally speaking long term share price weakness can be a bad sign, though contrarian investors might want to research the stock in hope of a turnaround. It's always interesting to track share price performance over the longer term. But to understand Sejong Telecom better, we need to consider many other factors. Even so, be aware that Sejong Telecom is showing 3 warning signs in our investment analysis , and 2 of those are a bit unpleasant...
If you are like me, then you will not want to miss this free list of undervalued small caps that insiders are buying.
Please note, the market returns quoted in this article reflect the market weighted average returns of stocks that currently trade on South Korean exchanges.
If you're looking to trade Sejong Telecom, open an account with the lowest-cost platform trusted by professionals, Interactive Brokers.
With clients in over 200 countries and territories, and access to 160 markets, IBKR lets you trade stocks, options, futures, forex, bonds and funds from a single integrated account.
Enjoy no hidden fees, no account minimums, and FX conversion rates as low as 0.03%, far better than what most brokers offer.
Sponsored ContentNew: Manage All Your Stock Portfolios in One Place
We've created the ultimate portfolio companion for stock investors, and it's free.
• Connect an unlimited number of Portfolios and see your total in one currency
• Be alerted to new Warning Signs or Risks via email or mobile
• Track the Fair Value of your stocks
Have feedback on this article? Concerned about the content? Get in touch with us directly. Alternatively, email editorial-team (at) simplywallst.com.
This article by Simply Wall St is general in nature. We provide commentary based on historical data and analyst forecasts only using an unbiased methodology and our articles are not intended to be financial advice. It does not constitute a recommendation to buy or sell any stock, and does not take account of your objectives, or your financial situation. We aim to bring you long-term focused analysis driven by fundamental data. Note that our analysis may not factor in the latest price-sensitive company announcements or qualitative material. Simply Wall St has no position in any stocks mentioned.
About KOSDAQ:A036630
Good value with adequate balance sheet.
Similar Companies
Market Insights

Community Narratives


