
Warren Buffett famously said, 'Volatility is far from synonymous with risk.' It's only natural to consider a company's balance sheet when you examine how risky it is, since debt is often involved when a business collapses. We can see that JOOYONTECH CO., Ltd (KRX:044380) does use debt in its business. But should shareholders be worried about its use of debt?
When Is Debt Dangerous?
Debt is a tool to help businesses grow, but if a business is incapable of paying off its lenders, then it exists at their mercy. If things get really bad, the lenders can take control of the business. However, a more common (but still painful) scenario is that it has to raise new equity capital at a low price, thus permanently diluting shareholders. Of course, debt can be an important tool in businesses, particularly capital heavy businesses. The first thing to do when considering how much debt a business uses is to look at its cash and debt together.
See our latest analysis for JOOYONTECH
How Much Debt Does JOOYONTECH Carry?
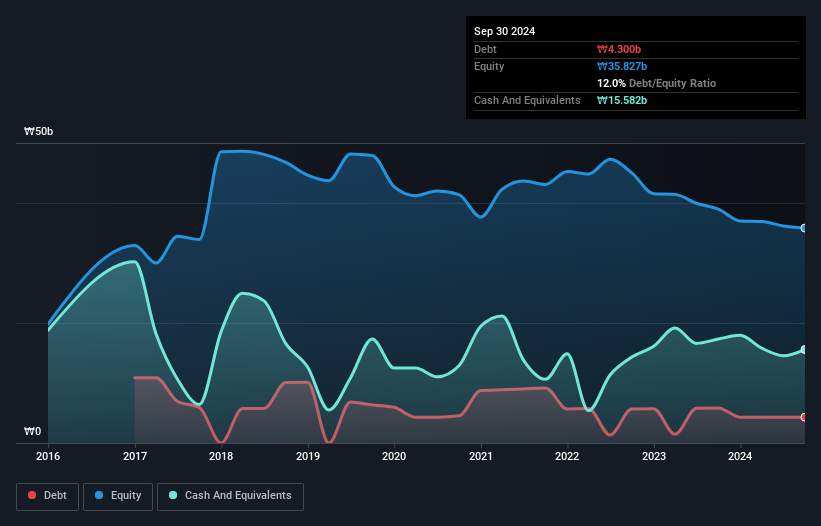
The image below, which you can click on for greater detail, shows that JOOYONTECH had debt of ₩4.30b at the end of September 2024, a reduction from ₩5.84b over a year. But on the other hand it also has ₩15.6b in cash, leading to a ₩11.3b net cash position.
How Strong Is JOOYONTECH's Balance Sheet?
We can see from the most recent balance sheet that JOOYONTECH had liabilities of ₩7.30b falling due within a year, and liabilities of ₩617.4m due beyond that. Offsetting this, it had ₩15.6b in cash and ₩4.52b in receivables that were due within 12 months. So it can boast ₩12.2b more liquid assets than total liabilities.
This luscious liquidity implies that JOOYONTECH's balance sheet is sturdy like a giant sequoia tree. Having regard to this fact, we think its balance sheet is as strong as an ox. Succinctly put, JOOYONTECH boasts net cash, so it's fair to say it does not have a heavy debt load! When analysing debt levels, the balance sheet is the obvious place to start. But you can't view debt in total isolation; since JOOYONTECH will need earnings to service that debt. So if you're keen to discover more about its earnings, it might be worth checking out this graph of its long term earnings trend.
Over 12 months, JOOYONTECH reported revenue of ₩50b, which is a gain of 7.6%, although it did not report any earnings before interest and tax. We usually like to see faster growth from unprofitable companies, but each to their own.
So How Risky Is JOOYONTECH?
Statistically speaking companies that lose money are riskier than those that make money. And we do note that JOOYONTECH had an earnings before interest and tax (EBIT) loss, over the last year. Indeed, in that time it burnt through ₩299m of cash and made a loss of ₩3.1b. While this does make the company a bit risky, it's important to remember it has net cash of ₩11.3b. That kitty means the company can keep spending for growth for at least two years, at current rates. Even though its balance sheet seems sufficiently liquid, debt always makes us a little nervous if a company doesn't produce free cash flow regularly. The balance sheet is clearly the area to focus on when you are analysing debt. But ultimately, every company can contain risks that exist outside of the balance sheet. For example JOOYONTECH has 3 warning signs (and 1 which is a bit unpleasant) we think you should know about.
If you're interested in investing in businesses that can grow profits without the burden of debt, then check out this free list of growing businesses that have net cash on the balance sheet.
The New Payments ETF Is Live on NASDAQ:
Money is moving to real-time rails, and a newly listed ETF now gives investors direct exposure. Fast settlement. Institutional custody. Simple access.
Explore how this launch could reshape portfolios
Sponsored ContentNew: Manage All Your Stock Portfolios in One Place
We've created the ultimate portfolio companion for stock investors, and it's free.
• Connect an unlimited number of Portfolios and see your total in one currency
• Be alerted to new Warning Signs or Risks via email or mobile
• Track the Fair Value of your stocks
Have feedback on this article? Concerned about the content? Get in touch with us directly. Alternatively, email editorial-team (at) simplywallst.com.
This article by Simply Wall St is general in nature. We provide commentary based on historical data and analyst forecasts only using an unbiased methodology and our articles are not intended to be financial advice. It does not constitute a recommendation to buy or sell any stock, and does not take account of your objectives, or your financial situation. We aim to bring you long-term focused analysis driven by fundamental data. Note that our analysis may not factor in the latest price-sensitive company announcements or qualitative material. Simply Wall St has no position in any stocks mentioned.
About KOSE:A044380
Flawless balance sheet and slightly overvalued.
Market Insights

Weekly Picks

THE KINGDOM OF BROWN GOODS: WHY MGPI IS BEING CRUSHED BY INVENTORY & PRIMED FOR RESURRECTION


Why Vertical Aerospace (NYSE: EVTL) is Worth Possibly Over 13x its Current Price


The Quiet Giant That Became AI’s Power Grid
Recently Updated Narratives


MINISO's fair value is projected at 26.69 with an anticipated PE ratio shift of 20x

Fiverr International will transform the freelance industry with AI-powered growth

Stride Stock: Online Education Finds Its Second Act
Popular Narratives


MicroVision will explode future revenue by 380.37% with a vision towards success


Crazy Undervalued 42 Baggers Silver Play (Active & Running Mine)


