- South Korea
- /
- Tech Hardware
- /
- KOSE:A005930
Investors in Samsung Electronics (KRX:005930) have seen respectable returns of 48% over the past five years


While Samsung Electronics Co., Ltd. (KRX:005930) shareholders are probably generally happy, the stock hasn't had particularly good run recently, with the share price falling 21% in the last quarter. But at least the stock is up over the last five years. In that time, it is up 30%, which isn't bad, but is below the market return of 44%.
With that in mind, it's worth seeing if the company's underlying fundamentals have been the driver of long term performance, or if there are some discrepancies.
Check out our latest analysis for Samsung Electronics
To paraphrase Benjamin Graham: Over the short term the market is a voting machine, but over the long term it's a weighing machine. By comparing earnings per share (EPS) and share price changes over time, we can get a feel for how investor attitudes to a company have morphed over time.
Samsung Electronics' earnings per share are down 3.9% per year, despite strong share price performance over five years.
By glancing at these numbers, we'd posit that the decline in earnings per share is not representative of how the business has changed over the years. Since the change in EPS doesn't seem to correlate with the change in share price, it's worth taking a look at other metrics.
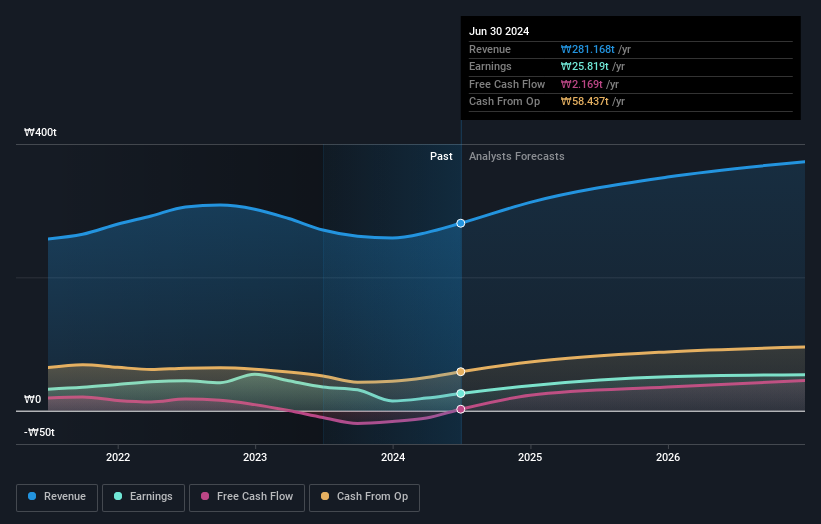
In contrast revenue growth of 4.6% per year is probably viewed as evidence that Samsung Electronics is growing, a real positive. It's quite possible that management are prioritizing revenue growth over EPS growth at the moment.
The company's revenue and earnings (over time) are depicted in the image below (click to see the exact numbers).
Samsung Electronics is well known by investors, and plenty of clever analysts have tried to predict the future profit levels. So we recommend checking out this free report showing consensus forecasts
What About Dividends?
When looking at investment returns, it is important to consider the difference between total shareholder return (TSR) and share price return. Whereas the share price return only reflects the change in the share price, the TSR includes the value of dividends (assuming they were reinvested) and the benefit of any discounted capital raising or spin-off. Arguably, the TSR gives a more comprehensive picture of the return generated by a stock. In the case of Samsung Electronics, it has a TSR of 48% for the last 5 years. That exceeds its share price return that we previously mentioned. This is largely a result of its dividend payments!
A Different Perspective
We regret to report that Samsung Electronics shareholders are down 6.0% for the year (even including dividends). Unfortunately, that's worse than the broader market decline of 1.0%. However, it could simply be that the share price has been impacted by broader market jitters. It might be worth keeping an eye on the fundamentals, in case there's a good opportunity. Longer term investors wouldn't be so upset, since they would have made 8%, each year, over five years. It could be that the recent sell-off is an opportunity, so it may be worth checking the fundamental data for signs of a long term growth trend. It's always interesting to track share price performance over the longer term. But to understand Samsung Electronics better, we need to consider many other factors. For instance, we've identified 2 warning signs for Samsung Electronics that you should be aware of.
Of course Samsung Electronics may not be the best stock to buy. So you may wish to see this free collection of growth stocks.
Please note, the market returns quoted in this article reflect the market weighted average returns of stocks that currently trade on South Korean exchanges.
New: Manage All Your Stock Portfolios in One Place
We've created the ultimate portfolio companion for stock investors, and it's free.
• Connect an unlimited number of Portfolios and see your total in one currency
• Be alerted to new Warning Signs or Risks via email or mobile
• Track the Fair Value of your stocks
Have feedback on this article? Concerned about the content? Get in touch with us directly. Alternatively, email editorial-team (at) simplywallst.com.
This article by Simply Wall St is general in nature. We provide commentary based on historical data and analyst forecasts only using an unbiased methodology and our articles are not intended to be financial advice. It does not constitute a recommendation to buy or sell any stock, and does not take account of your objectives, or your financial situation. We aim to bring you long-term focused analysis driven by fundamental data. Note that our analysis may not factor in the latest price-sensitive company announcements or qualitative material. Simply Wall St has no position in any stocks mentioned.
About KOSE:A005930
Samsung Electronics
Engages in the consumer electronics, information technology and mobile communications, and device solutions businesses worldwide.
Flawless balance sheet, undervalued and pays a dividend.
