- South Korea
- /
- Tech Hardware
- /
- KOSDAQ:A033560
Health Check: How Prudently Does Bluecom (KOSDAQ:033560) Use Debt?

Legendary fund manager Li Lu (who Charlie Munger backed) once said, 'The biggest investment risk is not the volatility of prices, but whether you will suffer a permanent loss of capital.' When we think about how risky a company is, we always like to look at its use of debt, since debt overload can lead to ruin. As with many other companies Bluecom Co., Ltd. (KOSDAQ:033560) makes use of debt. But the more important question is: how much risk is that debt creating?
Why Does Debt Bring Risk?
Debt is a tool to help businesses grow, but if a business is incapable of paying off its lenders, then it exists at their mercy. Ultimately, if the company can't fulfill its legal obligations to repay debt, shareholders could walk away with nothing. While that is not too common, we often do see indebted companies permanently diluting shareholders because lenders force them to raise capital at a distressed price. By replacing dilution, though, debt can be an extremely good tool for businesses that need capital to invest in growth at high rates of return. The first step when considering a company's debt levels is to consider its cash and debt together.
See our latest analysis for Bluecom
How Much Debt Does Bluecom Carry?
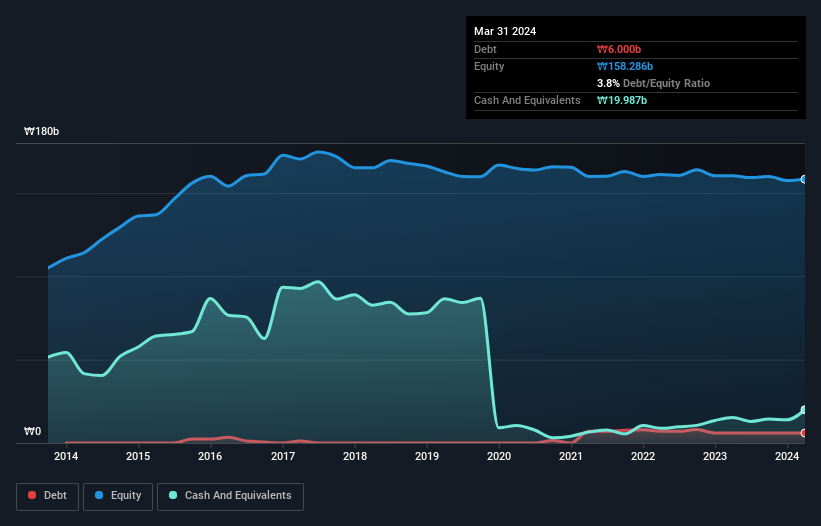
The chart below, which you can click on for greater detail, shows that Bluecom had ₩6.00b in debt in March 2024; about the same as the year before. But on the other hand it also has ₩20.0b in cash, leading to a ₩14.0b net cash position.
A Look At Bluecom's Liabilities
The latest balance sheet data shows that Bluecom had liabilities of ₩15.9b due within a year, and liabilities of ₩2.61b falling due after that. Offsetting this, it had ₩20.0b in cash and ₩2.57b in receivables that were due within 12 months. So it actually has ₩4.02b more liquid assets than total liabilities.
This surplus suggests that Bluecom has a conservative balance sheet, and could probably eliminate its debt without much difficulty. Simply put, the fact that Bluecom has more cash than debt is arguably a good indication that it can manage its debt safely. The balance sheet is clearly the area to focus on when you are analysing debt. But it is Bluecom's earnings that will influence how the balance sheet holds up in the future. So when considering debt, it's definitely worth looking at the earnings trend. Click here for an interactive snapshot.
Over 12 months, Bluecom made a loss at the EBIT level, and saw its revenue drop to ₩30b, which is a fall of 42%. To be frank that doesn't bode well.
So How Risky Is Bluecom?
We have no doubt that loss making companies are, in general, riskier than profitable ones. And we do note that Bluecom had an earnings before interest and tax (EBIT) loss, over the last year. Indeed, in that time it burnt through ₩2.2b of cash and made a loss of ₩1.9b. But the saving grace is the ₩14.0b on the balance sheet. That kitty means the company can keep spending for growth for at least two years, at current rates. Even though its balance sheet seems sufficiently liquid, debt always makes us a little nervous if a company doesn't produce free cash flow regularly. There's no doubt that we learn most about debt from the balance sheet. But ultimately, every company can contain risks that exist outside of the balance sheet. We've identified 2 warning signs with Bluecom (at least 1 which shouldn't be ignored) , and understanding them should be part of your investment process.
If you're interested in investing in businesses that can grow profits without the burden of debt, then check out this free list of growing businesses that have net cash on the balance sheet.
The New Payments ETF Is Live on NASDAQ:
Money is moving to real-time rails, and a newly listed ETF now gives investors direct exposure. Fast settlement. Institutional custody. Simple access.
Explore how this launch could reshape portfolios
Sponsored ContentValuation is complex, but we're here to simplify it.
Discover if Bluecom might be undervalued or overvalued with our detailed analysis, featuring fair value estimates, potential risks, dividends, insider trades, and its financial condition.
Access Free AnalysisHave feedback on this article? Concerned about the content? Get in touch with us directly. Alternatively, email editorial-team (at) simplywallst.com.
This article by Simply Wall St is general in nature. We provide commentary based on historical data and analyst forecasts only using an unbiased methodology and our articles are not intended to be financial advice. It does not constitute a recommendation to buy or sell any stock, and does not take account of your objectives, or your financial situation. We aim to bring you long-term focused analysis driven by fundamental data. Note that our analysis may not factor in the latest price-sensitive company announcements or qualitative material. Simply Wall St has no position in any stocks mentioned.
Have feedback on this article? Concerned about the content? Get in touch with us directly. Alternatively, email editorial-team@simplywallst.com
About KOSDAQ:A033560
Bluecom
Operates as a wireless technology company in South Korea and internationally.
Low risk and slightly overvalued.
Market Insights

Weekly Picks

THE KINGDOM OF BROWN GOODS: WHY MGPI IS BEING CRUSHED BY INVENTORY & PRIMED FOR RESURRECTION


Why Vertical Aerospace (NYSE: EVTL) is Worth Possibly Over 13x its Current Price


The Quiet Giant That Became AI’s Power Grid
Recently Updated Narratives

Butler National (Buks) outperforms.


A tech powerhouse quietly powering the world’s AI infrastructure.


Keppel DC REIT (SGX: AJBU) is a resilient gem in the data center space.
Popular Narratives

MicroVision will explode future revenue by 380.37% with a vision towards success


Crazy Undervalued 42 Baggers Silver Play (Active & Running Mine)


