- South Korea
- /
- Communications
- /
- KOSDAQ:A015710
Kocom Co., Ltd.'s (KOSDAQ:015710) Stock is Soaring But Financials Seem Inconsistent: Will The Uptrend Continue?

Kocom (KOSDAQ:015710) has had a great run on the share market with its stock up by a significant 18% over the last three months. However, we decided to pay attention to the company's fundamentals which don't appear to give a clear sign about the company's financial health. Specifically, we decided to study Kocom's ROE in this article.
Return on equity or ROE is an important factor to be considered by a shareholder because it tells them how effectively their capital is being reinvested. In simpler terms, it measures the profitability of a company in relation to shareholder's equity.
Check out our latest analysis for Kocom
How To Calculate Return On Equity?
The formula for ROE is:
Return on Equity = Net Profit (from continuing operations) ÷ Shareholders' Equity
So, based on the above formula, the ROE for Kocom is:
5.7% = ₩6.9b ÷ ₩120b (Based on the trailing twelve months to September 2020).
The 'return' is the yearly profit. One way to conceptualize this is that for each ₩1 of shareholders' capital it has, the company made ₩0.06 in profit.
What Is The Relationship Between ROE And Earnings Growth?
So far, we've learned that ROE is a measure of a company's profitability. Based on how much of its profits the company chooses to reinvest or "retain", we are then able to evaluate a company's future ability to generate profits. Assuming everything else remains unchanged, the higher the ROE and profit retention, the higher the growth rate of a company compared to companies that don't necessarily bear these characteristics.
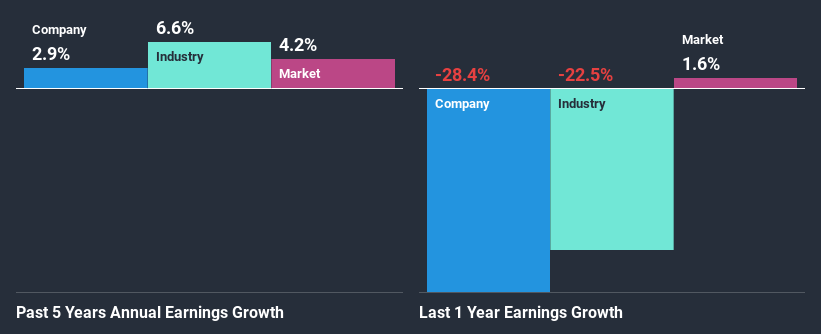
A Side By Side comparison of Kocom's Earnings Growth And 5.7% ROE
On the face of it, Kocom's ROE is not much to talk about. Yet, a closer study shows that the company's ROE is similar to the industry average of 6.5%. We can see that Kocom has grown at a five year net income growth average rate of 2.9%, which is a bit on the lower side. Bear in mind, the company's ROE is not very high . Hence, this does provide some context to low earnings growth seen by the company.
We then compared Kocom's net income growth with the industry and found that the company's growth figure is lower than the average industry growth rate of 6.6% in the same period, which is a bit concerning.
Earnings growth is an important metric to consider when valuing a stock. It’s important for an investor to know whether the market has priced in the company's expected earnings growth (or decline). By doing so, they will have an idea if the stock is headed into clear blue waters or if swampy waters await. If you're wondering about Kocom's's valuation, check out this gauge of its price-to-earnings ratio, as compared to its industry.
Is Kocom Efficiently Re-investing Its Profits?
Despite having a moderate three-year median payout ratio of 33% (implying that the company retains the remaining 67% of its income), Kocom's earnings growth was quite low. Therefore, there might be some other reasons to explain the lack in that respect. For example, the business could be in decline.
In addition, Kocom has been paying dividends over a period of at least ten years suggesting that keeping up dividend payments is way more important to the management even if it comes at the cost of business growth.
Summary
In total, we're a bit ambivalent about Kocom's performance. Even though it appears to be retaining most of its profits, given the low ROE, investors may not be benefitting from all that reinvestment after all. The low earnings growth suggests our theory correct. Wrapping up, we would proceed with caution with this company and one way of doing that would be to look at the risk profile of the business. To know the 1 risk we have identified for Kocom visit our risks dashboard for free.
If you’re looking to trade Kocom, open an account with the lowest-cost* platform trusted by professionals, Interactive Brokers. Their clients from over 200 countries and territories trade stocks, options, futures, forex, bonds and funds worldwide from a single integrated account. Promoted
The New Payments ETF Is Live on NASDAQ:
Money is moving to real-time rails, and a newly listed ETF now gives investors direct exposure. Fast settlement. Institutional custody. Simple access.
Explore how this launch could reshape portfolios
Sponsored ContentValuation is complex, but we're here to simplify it.
Discover if Kocom might be undervalued or overvalued with our detailed analysis, featuring fair value estimates, potential risks, dividends, insider trades, and its financial condition.
Access Free AnalysisThis article by Simply Wall St is general in nature. It does not constitute a recommendation to buy or sell any stock, and does not take account of your objectives, or your financial situation. We aim to bring you long-term focused analysis driven by fundamental data. Note that our analysis may not factor in the latest price-sensitive company announcements or qualitative material. Simply Wall St has no position in any stocks mentioned.
*Interactive Brokers Rated Lowest Cost Broker by StockBrokers.com Annual Online Review 2020
Have feedback on this article? Concerned about the content? Get in touch with us directly. Alternatively, email editorial-team (at) simplywallst.com.
About KOSDAQ:A015710
Kocom
Develops various digital solutions for housing, building, and commercial areas primarily in South Korea and Japan.
Low risk not a dividend payer.
Market Insights

Weekly Picks

THE KINGDOM OF BROWN GOODS: WHY MGPI IS BEING CRUSHED BY INVENTORY & PRIMED FOR RESURRECTION


Why Vertical Aerospace (NYSE: EVTL) is Worth Possibly Over 13x its Current Price


The Quiet Giant That Became AI’s Power Grid
Recently Updated Narratives


A case for USD $14.81 per share based on book value. Be warned, this is a micro-cap dependent on a single mine.

Occidental Petroleum to Become Fairly Priced at $68.29 According to Future Projections

Agfa-Gevaert is a digital and materials turnaround opportunity, with growth potential in ZIRFON, but carrying legacy risks.
Popular Narratives


MicroVision will explode future revenue by 380.37% with a vision towards success


Crazy Undervalued 42 Baggers Silver Play (Active & Running Mine)


