- South Korea
- /
- General Merchandise and Department Stores
- /
- KOSE:A057050
How Much Did Hyundai Home Shopping Network's(KRX:057050) Shareholders Earn From Share Price Movements Over The Last Five Years?


The main aim of stock picking is to find the market-beating stocks. But even the best stock picker will only win with some selections. So we wouldn't blame long term Hyundai Home Shopping Network Corporation (KRX:057050) shareholders for doubting their decision to hold, with the stock down 37% over a half decade.
See our latest analysis for Hyundai Home Shopping Network
In his essay The Superinvestors of Graham-and-Doddsville Warren Buffett described how share prices do not always rationally reflect the value of a business. One imperfect but simple way to consider how the market perception of a company has shifted is to compare the change in the earnings per share (EPS) with the share price movement.
During the five years over which the share price declined, Hyundai Home Shopping Network's earnings per share (EPS) dropped by 5.0% each year. This reduction in EPS is less than the 9% annual reduction in the share price. This implies that the market was previously too optimistic about the stock. The low P/E ratio of 10.01 further reflects this reticence.
The company's earnings per share (over time) is depicted in the image below (click to see the exact numbers).
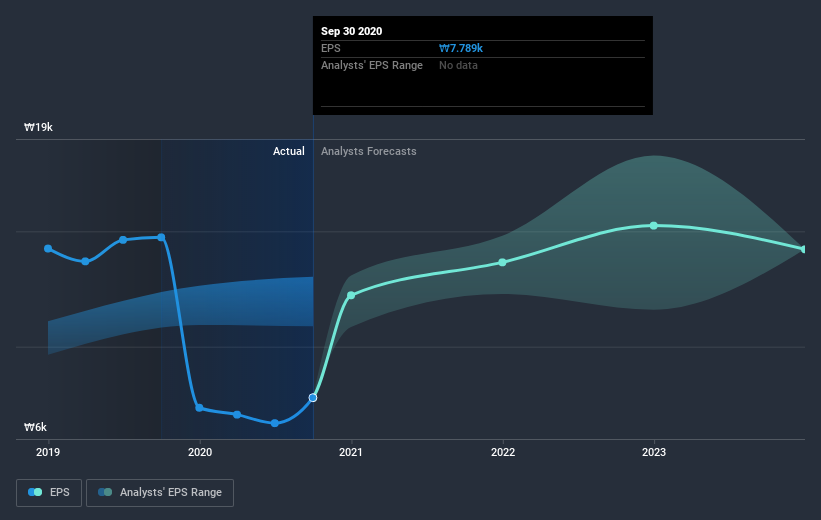
Dive deeper into Hyundai Home Shopping Network's key metrics by checking this interactive graph of Hyundai Home Shopping Network's earnings, revenue and cash flow.
What About Dividends?
It is important to consider the total shareholder return, as well as the share price return, for any given stock. Whereas the share price return only reflects the change in the share price, the TSR includes the value of dividends (assuming they were reinvested) and the benefit of any discounted capital raising or spin-off. So for companies that pay a generous dividend, the TSR is often a lot higher than the share price return. We note that for Hyundai Home Shopping Network the TSR over the last 5 years was -31%, which is better than the share price return mentioned above. This is largely a result of its dividend payments!
A Different Perspective
Hyundai Home Shopping Network provided a TSR of 20% over the last twelve months. But that was short of the market average. But at least that's still a gain! Over five years the TSR has been a reduction of 5% per year, over five years. So this might be a sign the business has turned its fortunes around. I find it very interesting to look at share price over the long term as a proxy for business performance. But to truly gain insight, we need to consider other information, too. Case in point: We've spotted 2 warning signs for Hyundai Home Shopping Network you should be aware of.
Of course Hyundai Home Shopping Network may not be the best stock to buy. So you may wish to see this free collection of growth stocks.
Please note, the market returns quoted in this article reflect the market weighted average returns of stocks that currently trade on KR exchanges.
If you decide to trade Hyundai Home Shopping Network, use the lowest-cost* platform that is rated #1 Overall by Barron’s, Interactive Brokers. Trade stocks, options, futures, forex, bonds and funds on 135 markets, all from a single integrated account. Promoted
Valuation is complex, but we're here to simplify it.
Discover if Hyundai Home Shopping Network might be undervalued or overvalued with our detailed analysis, featuring fair value estimates, potential risks, dividends, insider trades, and its financial condition.
Access Free AnalysisThis article by Simply Wall St is general in nature. It does not constitute a recommendation to buy or sell any stock, and does not take account of your objectives, or your financial situation. We aim to bring you long-term focused analysis driven by fundamental data. Note that our analysis may not factor in the latest price-sensitive company announcements or qualitative material. Simply Wall St has no position in any stocks mentioned.
*Interactive Brokers Rated Lowest Cost Broker by StockBrokers.com Annual Online Review 2020
Have feedback on this article? Concerned about the content? Get in touch with us directly. Alternatively, email editorial-team (at) simplywallst.com.
About KOSE:A057050
Hyundai Home Shopping Network
Operates an online shopping company in South Korea.
Flawless balance sheet, good value and pays a dividend.
Similar Companies
Market Insights

Community Narratives
