
Advertisement
- South Korea
- /
- Pharma
- /
- KOSDAQ:A052670
A Look At The Intrinsic Value Of Cheilbio Co., Ltd. (KOSDAQ:052670)

In this article we are going to estimate the intrinsic value of Cheilbio Co., Ltd. (KOSDAQ:052670) by taking the expected future cash flows and discounting them to today's value. We will use the Discounted Cash Flow (DCF) model on this occasion. It may sound complicated, but actually it is quite simple!
We generally believe that a company's value is the present value of all of the cash it will generate in the future. However, a DCF is just one valuation metric among many, and it is not without flaws. If you want to learn more about discounted cash flow, the rationale behind this calculation can be read in detail in the Simply Wall St analysis model.
See our latest analysis for Cheilbio
Is Cheilbio fairly valued?
We use what is known as a 2-stage model, which simply means we have two different periods of growth rates for the company's cash flows. Generally the first stage is higher growth, and the second stage is a lower growth phase. To start off with, we need to estimate the next ten years of cash flows. Seeing as no analyst estimates of free cash flow are available to us, we have extrapolate the previous free cash flow (FCF) from the company's last reported value. We assume companies with shrinking free cash flow will slow their rate of shrinkage, and that companies with growing free cash flow will see their growth rate slow, over this period. We do this to reflect that growth tends to slow more in the early years than it does in later years.
A DCF is all about the idea that a dollar in the future is less valuable than a dollar today, so we need to discount the sum of these future cash flows to arrive at a present value estimate:
10-year free cash flow (FCF) forecast
| 2021 | 2022 | 2023 | 2024 | 2025 | 2026 | 2027 | 2028 | 2029 | 2030 | |
| Levered FCF (₩, Millions) | ₩3.55b | ₩4.20b | ₩4.79b | ₩5.31b | ₩5.78b | ₩6.19b | ₩6.57b | ₩6.93b | ₩7.27b | ₩7.60b |
| Growth Rate Estimate Source | Est @ 24.68% | Est @ 18.38% | Est @ 13.97% | Est @ 10.88% | Est @ 8.72% | Est @ 7.21% | Est @ 6.15% | Est @ 5.41% | Est @ 4.89% | Est @ 4.53% |
| Present Value (₩, Millions) Discounted @ 8.4% | ₩3.3k | ₩3.6k | ₩3.8k | ₩3.8k | ₩3.9k | ₩3.8k | ₩3.7k | ₩3.6k | ₩3.5k | ₩3.4k |
("Est" = FCF growth rate estimated by Simply Wall St)
Present Value of 10-year Cash Flow (PVCF) = ₩36b
After calculating the present value of future cash flows in the initial 10-year period, we need to calculate the Terminal Value, which accounts for all future cash flows beyond the first stage. For a number of reasons a very conservative growth rate is used that cannot exceed that of a country's GDP growth. In this case we have used the 5-year average of the 10-year government bond yield (3.7%) to estimate future growth. In the same way as with the 10-year 'growth' period, we discount future cash flows to today's value, using a cost of equity of 8.4%.
Terminal Value (TV)= FCF2030 × (1 + g) ÷ (r – g) = ₩7.6b× (1 + 3.7%) ÷ (8.4%– 3.7%) = ₩165b
Present Value of Terminal Value (PVTV)= TV / (1 + r)10= ₩165b÷ ( 1 + 8.4%)10= ₩73b
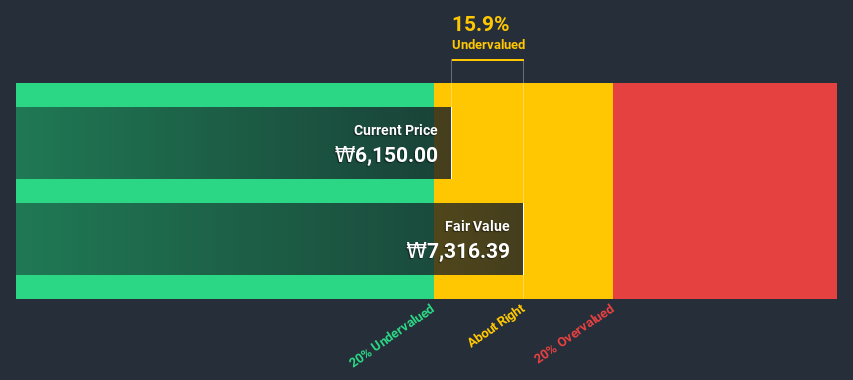
The total value is the sum of cash flows for the next ten years plus the discounted terminal value, which results in the Total Equity Value, which in this case is ₩110b. In the final step we divide the equity value by the number of shares outstanding. Relative to the current share price of ₩6.2k, the company appears about fair value at a 16% discount to where the stock price trades currently. Remember though, that this is just an approximate valuation, and like any complex formula - garbage in, garbage out.
Important assumptions
Now the most important inputs to a discounted cash flow are the discount rate, and of course, the actual cash flows. If you don't agree with these result, have a go at the calculation yourself and play with the assumptions. The DCF also does not consider the possible cyclicality of an industry, or a company's future capital requirements, so it does not give a full picture of a company's potential performance. Given that we are looking at Cheilbio as potential shareholders, the cost of equity is used as the discount rate, rather than the cost of capital (or weighted average cost of capital, WACC) which accounts for debt. In this calculation we've used 8.4%, which is based on a levered beta of 0.800. Beta is a measure of a stock's volatility, compared to the market as a whole. We get our beta from the industry average beta of globally comparable companies, with an imposed limit between 0.8 and 2.0, which is a reasonable range for a stable business.
Looking Ahead:
Valuation is only one side of the coin in terms of building your investment thesis, and it shouldn't be the only metric you look at when researching a company. The DCF model is not a perfect stock valuation tool. Rather it should be seen as a guide to "what assumptions need to be true for this stock to be under/overvalued?" If a company grows at a different rate, or if its cost of equity or risk free rate changes sharply, the output can look very different. For Cheilbio, we've compiled three important aspects you should assess:
- Risks: Take risks, for example - Cheilbio has 4 warning signs we think you should be aware of.
- Other High Quality Alternatives: Do you like a good all-rounder? Explore our interactive list of high quality stocks to get an idea of what else is out there you may be missing!
- Other Environmentally-Friendly Companies: Concerned about the environment and think consumers will buy eco-friendly products more and more? Browse through our interactive list of companies that are thinking about a greener future to discover some stocks you may not have thought of!
PS. Simply Wall St updates its DCF calculation for every South Korean stock every day, so if you want to find the intrinsic value of any other stock just search here.
If you’re looking to trade Cheilbio, open an account with the lowest-cost* platform trusted by professionals, Interactive Brokers. Their clients from over 200 countries and territories trade stocks, options, futures, forex, bonds and funds worldwide from a single integrated account. Promoted
New: AI Stock Screener & Alerts
Our new AI Stock Screener scans the market every day to uncover opportunities.
• Dividend Powerhouses (3%+ Yield)
• Undervalued Small Caps with Insider Buying
• High growth Tech and AI Companies
Or build your own from over 50 metrics.
This article by Simply Wall St is general in nature. It does not constitute a recommendation to buy or sell any stock, and does not take account of your objectives, or your financial situation. We aim to bring you long-term focused analysis driven by fundamental data. Note that our analysis may not factor in the latest price-sensitive company announcements or qualitative material. Simply Wall St has no position in any stocks mentioned.
*Interactive Brokers Rated Lowest Cost Broker by StockBrokers.com Annual Online Review 2020
Have feedback on this article? Concerned about the content? Get in touch with us directly. Alternatively, email editorial-team (at) simplywallst.com.
About KOSDAQ:A052670
Cheilbio
Cheilbio Co., Ltd. produces and sells veterinary products for pig, cattle, chicken, aqua, and other animals in South Korea.
Flawless balance sheet with weak fundamentals.
Market Insights

Advertisement
Community Narratives
Pinterest will surge as advertising innovations ignite revenue growth
Fair Value US$42.63|26.1% undervalued
BR
Community Contributor
Brambles' Revenue Set to Climb 14% with Profit Margins Following
Fair Value AU$21.90|4.2% overvalued
RO
Community Contributor
Challenging Future for STG as Organic Sales Decline by 8.8%
Fair Value DKK 116.13|27.0% undervalued
KA
Community Contributor