- South Korea
- /
- Pharma
- /
- KOSDAQ:A000250
Subdued Growth No Barrier To Sam Chun Dang Pharm. Co., Ltd (KOSDAQ:000250) With Shares Advancing 44%


Sam Chun Dang Pharm. Co., Ltd (KOSDAQ:000250) shares have continued their recent momentum with a 44% gain in the last month alone. The last month tops off a massive increase of 194% in the last year.
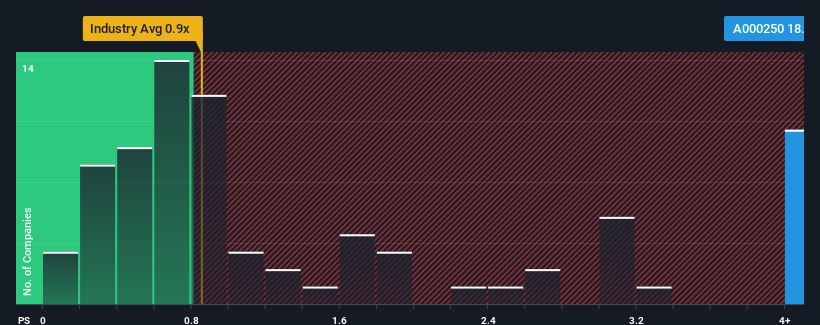
Since its price has surged higher, you could be forgiven for thinking Sam Chun Dang Pharm is a stock to steer clear of with a price-to-sales ratios (or "P/S") of 18.9x, considering almost half the companies in Korea's Pharmaceuticals industry have P/S ratios below 0.9x. However, the P/S might be quite high for a reason and it requires further investigation to determine if it's justified.
View our latest analysis for Sam Chun Dang Pharm
How Sam Chun Dang Pharm Has Been Performing
Sam Chun Dang Pharm has been doing a good job lately as it's been growing revenue at a solid pace. One possibility is that the P/S ratio is high because investors think this respectable revenue growth will be enough to outperform the broader industry in the near future. You'd really hope so, otherwise you're paying a pretty hefty price for no particular reason.
Want the full picture on earnings, revenue and cash flow for the company? Then our free report on Sam Chun Dang Pharm will help you shine a light on its historical performance.What Are Revenue Growth Metrics Telling Us About The High P/S?
There's an inherent assumption that a company should far outperform the industry for P/S ratios like Sam Chun Dang Pharm's to be considered reasonable.
Retrospectively, the last year delivered a decent 9.6% gain to the company's revenues. Revenue has also lifted 19% in aggregate from three years ago, partly thanks to the last 12 months of growth. So we can start by confirming that the company has actually done a good job of growing revenue over that time.
Comparing that to the industry, which is predicted to deliver 55% growth in the next 12 months, the company's momentum is weaker, based on recent medium-term annualised revenue results.
With this information, we find it concerning that Sam Chun Dang Pharm is trading at a P/S higher than the industry. It seems most investors are ignoring the fairly limited recent growth rates and are hoping for a turnaround in the company's business prospects. Only the boldest would assume these prices are sustainable as a continuation of recent revenue trends is likely to weigh heavily on the share price eventually.
What Does Sam Chun Dang Pharm's P/S Mean For Investors?
Shares in Sam Chun Dang Pharm have seen a strong upwards swing lately, which has really helped boost its P/S figure. Generally, our preference is to limit the use of the price-to-sales ratio to establishing what the market thinks about the overall health of a company.
The fact that Sam Chun Dang Pharm currently trades on a higher P/S relative to the industry is an oddity, since its recent three-year growth is lower than the wider industry forecast. Right now we aren't comfortable with the high P/S as this revenue performance isn't likely to support such positive sentiment for long. Unless the recent medium-term conditions improve markedly, it's very challenging to accept these the share price as being reasonable.
Don't forget that there may be other risks. For instance, we've identified 2 warning signs for Sam Chun Dang Pharm that you should be aware of.
If these risks are making you reconsider your opinion on Sam Chun Dang Pharm, explore our interactive list of high quality stocks to get an idea of what else is out there.
If you're looking to trade Sam Chun Dang Pharm, open an account with the lowest-cost platform trusted by professionals, Interactive Brokers.
With clients in over 200 countries and territories, and access to 160 markets, IBKR lets you trade stocks, options, futures, forex, bonds and funds from a single integrated account.
Enjoy no hidden fees, no account minimums, and FX conversion rates as low as 0.03%, far better than what most brokers offer.
Sponsored ContentNew: Manage All Your Stock Portfolios in One Place
We've created the ultimate portfolio companion for stock investors, and it's free.
• Connect an unlimited number of Portfolios and see your total in one currency
• Be alerted to new Warning Signs or Risks via email or mobile
• Track the Fair Value of your stocks
Have feedback on this article? Concerned about the content? Get in touch with us directly. Alternatively, email editorial-team (at) simplywallst.com.
This article by Simply Wall St is general in nature. We provide commentary based on historical data and analyst forecasts only using an unbiased methodology and our articles are not intended to be financial advice. It does not constitute a recommendation to buy or sell any stock, and does not take account of your objectives, or your financial situation. We aim to bring you long-term focused analysis driven by fundamental data. Note that our analysis may not factor in the latest price-sensitive company announcements or qualitative material. Simply Wall St has no position in any stocks mentioned.
Have feedback on this article? Concerned about the content? Get in touch with us directly. Alternatively, email editorial-team@simplywallst.com
About KOSDAQ:A000250
Sam Chun Dang Pharm
Engages in the manufacturing and sale of pharmaceutical products in South Korea.
Excellent balance sheet very low.
Market Insights

Community Narratives
