
Advertisement
As global markets grapple with renewed U.S.-China trade tensions and the impact of a prolonged U.S. government shutdown, major indices like the Nasdaq Composite and S&P 500 have experienced volatility, influenced by geopolitical uncertainties and investor anticipation of upcoming earnings reports. Despite these challenges, enthusiasm for tech companies with artificial intelligence exposure remains strong, highlighting the importance of adaptability and innovation in identifying promising high-growth tech stocks that can navigate such complex market dynamics effectively.
Top 10 High Growth Tech Companies Globally
| Name | Revenue Growth | Earnings Growth | Growth Rating |
|---|---|---|---|
| Giant Network Group | 31.77% | 34.18% | ★★★★★★ |
| Fositek | 34.27% | 44.80% | ★★★★★★ |
| Zhongji Innolight | 28.99% | 31.11% | ★★★★★★ |
| Gold Circuit Electronics | 26.64% | 35.16% | ★★★★★★ |
| Shengyi Electronics | 23.36% | 30.38% | ★★★★★★ |
| KebNi | 23.54% | 74.03% | ★★★★★★ |
| Hacksaw | 26.01% | 37.61% | ★★★★★★ |
| eWeLLLtd | 25.02% | 24.93% | ★★★★★★ |
| CD Projekt | 35.64% | 43.11% | ★★★★★★ |
| CARsgen Therapeutics Holdings | 100.40% | 118.16% | ★★★★★★ |
Let's review some notable picks from our screened stocks.
NEXON Games (KOSDAQ:A225570)
Simply Wall St Growth Rating: ★★★★☆☆
Overview: NEXON Games Co., Ltd. is a South Korean company that develops video games for both domestic and international markets, with a market cap of approximately ₩832.86 billion.
Operations: The company generates revenue primarily from its Game Development Division, which accounts for approximately ₩244.87 billion. The Rental Sector contributes a smaller portion, with revenues of around ₩4.86 billion.
Amidst a challenging fiscal period, NEXON Games has demonstrated resilience and strategic foresight through its aggressive share repurchase program, buying back 1.7% of its shares for KRW 15 billion. This move underscores management's confidence in the company's value despite recent financial setbacks, including a year-over-year sales decrease to KRW 89.88 billion and a deepening net loss of KRW 23.57 billion for the first half of 2025. However, with an anticipated earnings growth rate of 70.3% annually—significantly outpacing the South Korean market average—NEXON is poised to leverage its R&D investments effectively, which currently stand robust at enhancing product offerings and user engagement in the competitive gaming sector.
- Take a closer look at NEXON Games' potential here in our health report.
Review our historical performance report to gain insights into NEXON Games''s past performance.
Gentrack Group (NZSE:GTK)
Simply Wall St Growth Rating: ★★★★☆☆
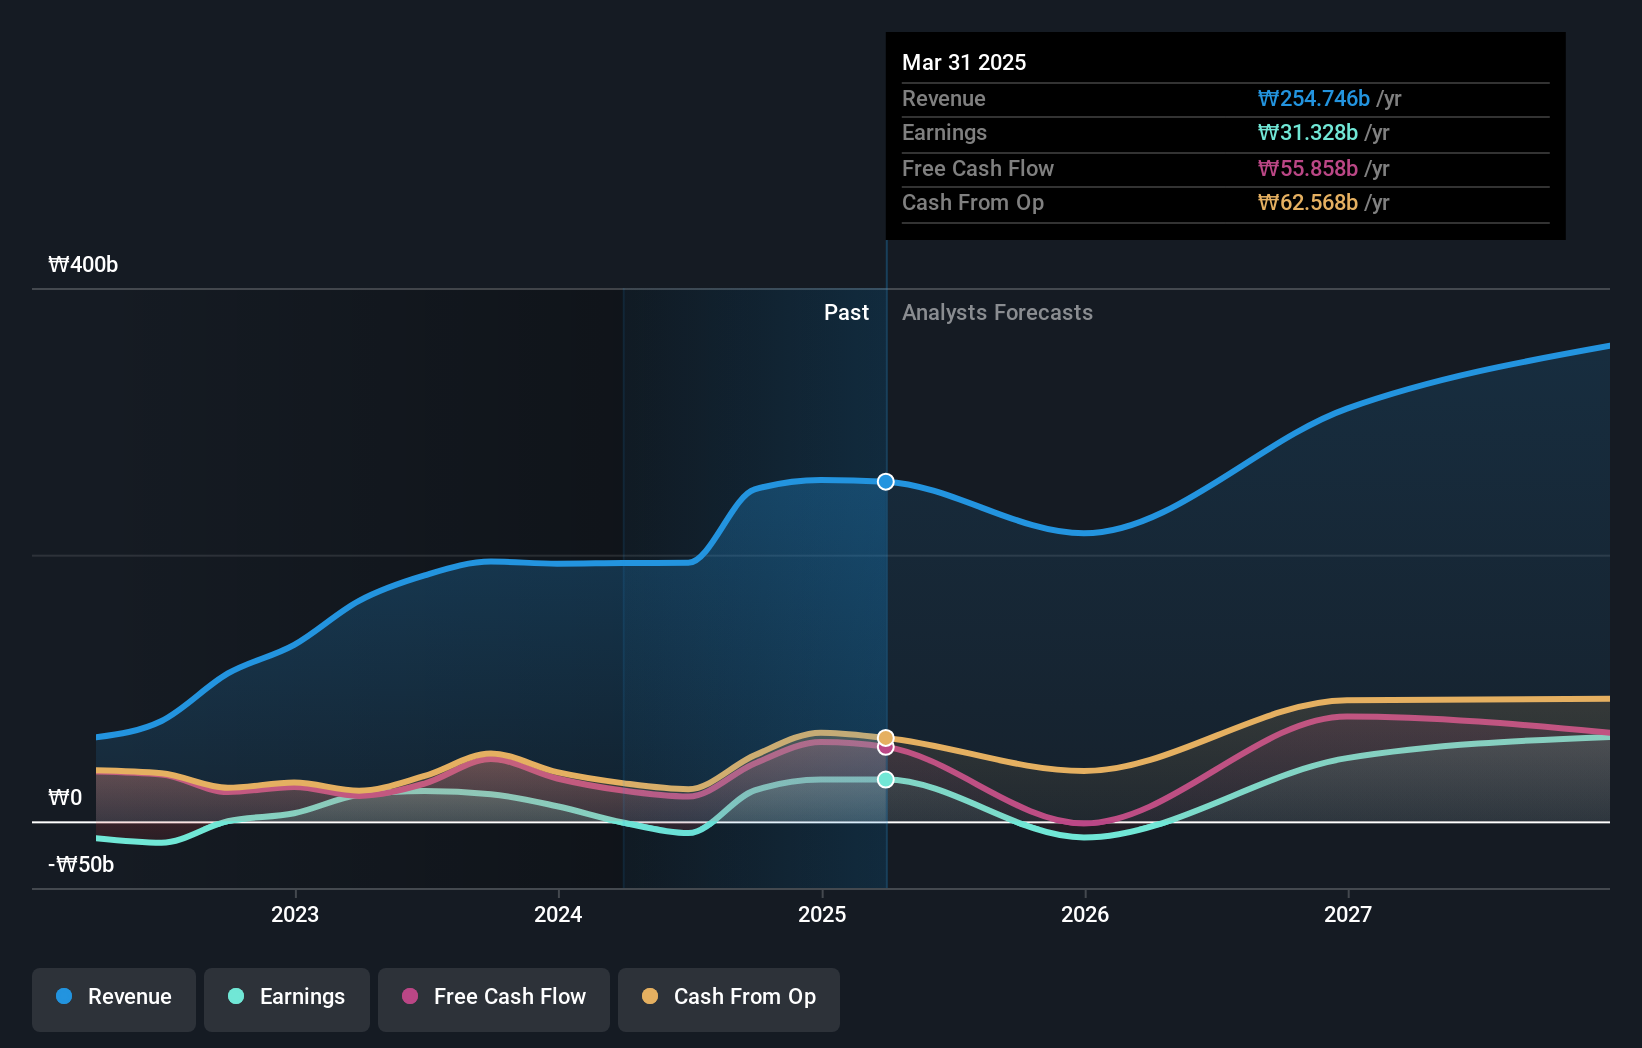
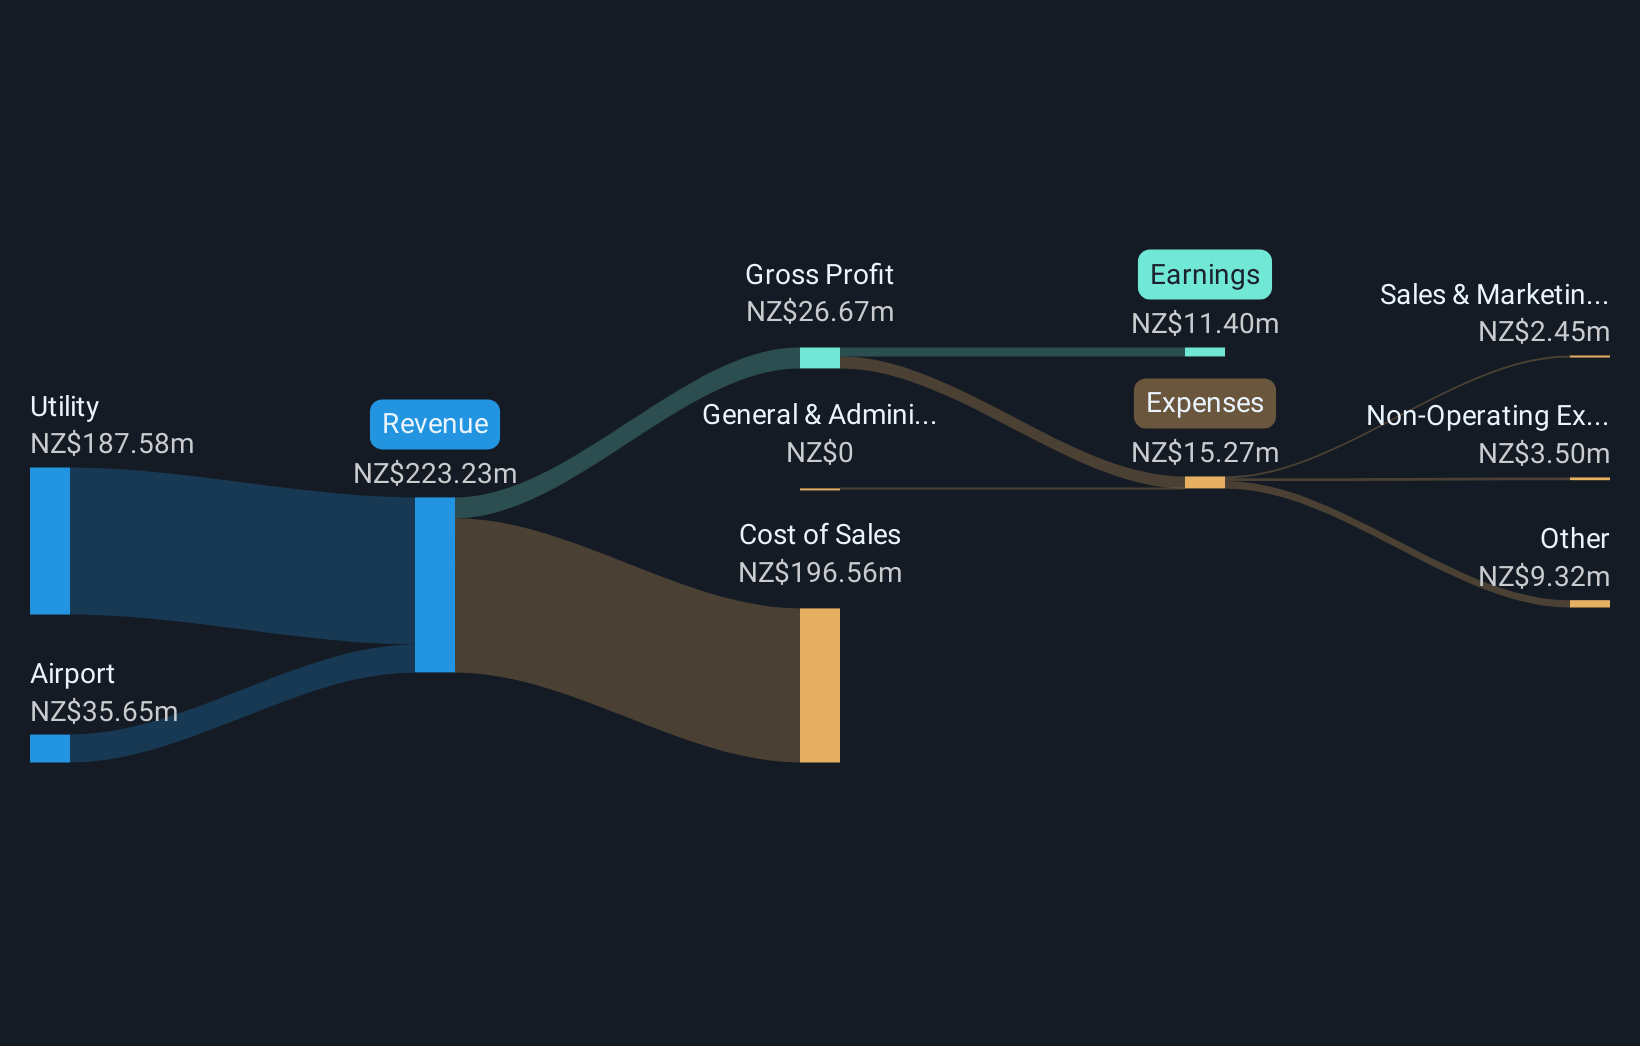
Overview: Gentrack Group Limited specializes in creating, integrating, and supporting enterprise billing and customer management software solutions for the energy, water utility, and airport sectors, with a market capitalization of NZ$980.31 million.
Operations: The company generates revenue primarily from its utility and airport segments, with the utility segment contributing NZ$187.58 million and the airport segment contributing NZ$35.65 million.
Gentrack Group, recently added to the S&P Global BMI Index, is navigating a promising trajectory with expected revenue growth at a CAGR of over 15% and earnings forecast to surge by 27.9% annually. These figures notably outpace the broader New Zealand market's growth rates of 3.9% for revenue and 21.5% for earnings. The company's commitment to innovation is evident from its R&D investments which are pivotal in driving these superior performance metrics compared to industry averages. With high-quality past earnings and a significant uptick in profit by 52% over the past year, Gentrack is positioned well within the competitive tech landscape, despite an anticipated low return on equity of 13.8%. This blend of strategic index inclusion and robust financial guidance underscores Gentrack's potential in sustaining its upward growth curve amidst dynamic market conditions.
- Click to explore a detailed breakdown of our findings in Gentrack Group's health report.
Explore historical data to track Gentrack Group's performance over time in our Past section.
NanJi E-Commerce (SZSE:002127)
Simply Wall St Growth Rating: ★★★★★☆
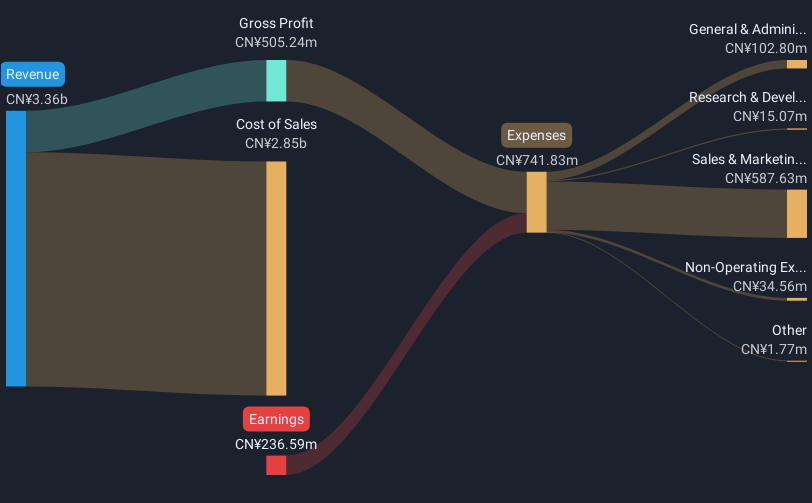
Overview: NanJi E-Commerce Co., LTD offers brand licensing and mobile Internet marketing services in China with a market capitalization of CN¥8.08 billion.
Operations: The company generates revenue primarily through its Time Interconnection Business, contributing CN¥2.62 billion, and the Antarctic E-Commerce Headquarters Business, which brings in CN¥539.64 million.
NanJi E-Commerce, amidst a transformative phase marked by recent bylaw amendments, is steering towards promising financial horizons with its revenue expected to climb at 21.3% annually. Despite current unprofitability, the company's earnings are projected to surge by an impressive 78.1% per year, signaling robust future profitability over the next three years. This growth trajectory is complemented by strategic R&D investments that underscore its commitment to innovation and market competitiveness in the bustling e-commerce sector. These developments not only enhance NanJi's operational framework but also position it advantageously for sustained growth in a rapidly evolving digital marketplace.
Where To Now?
- Click here to access our complete index of 246 Global High Growth Tech and AI Stocks.
- Invested in any of these stocks? Simplify your portfolio management with Simply Wall St and stay ahead with our alerts for any critical updates on your stocks.
- Maximize your investment potential with Simply Wall St, the comprehensive app that offers global market insights for free.
Curious About Other Options?
- Explore high-performing small cap companies that haven't yet garnered significant analyst attention.
- Fuel your portfolio with companies showing strong growth potential, backed by optimistic outlooks both from analysts and management.
- Find companies with promising cash flow potential yet trading below their fair value.
This article by Simply Wall St is general in nature. We provide commentary based on historical data and analyst forecasts only using an unbiased methodology and our articles are not intended to be financial advice. It does not constitute a recommendation to buy or sell any stock, and does not take account of your objectives, or your financial situation. We aim to bring you long-term focused analysis driven by fundamental data. Note that our analysis may not factor in the latest price-sensitive company announcements or qualitative material. Simply Wall St has no position in any stocks mentioned.
Valuation is complex, but we're here to simplify it.
Discover if NanJi E-Commerce might be undervalued or overvalued with our detailed analysis, featuring fair value estimates, potential risks, dividends, insider trades, and its financial condition.
Access Free AnalysisHave feedback on this article? Concerned about the content? Get in touch with us directly. Alternatively, email editorial-team@simplywallst.com
About SZSE:002127
NanJi E-Commerce
Provides brand licensing and comprehensive and mobile Internet marketing services in China.
Flawless balance sheet with high growth potential.
Market Insights

Advertisement
Community Narratives
A formidable player in AI and enterprise computing.
Fair Value US$210.00|3.9% overvalued
CO
Community Contributor
IREN's Bold Moves in Sustainable Bitcoin Mining & AI Data Centers
Fair Value US$89.00|21.8% undervalued
BL
Community Contributor
Cooling the Champions: The Aussie Tech Behind F1's Victories
Fair Value AU$12.40|40.6% undervalued
TR
Community Contributor