- South Korea
- /
- Metals and Mining
- /
- KOSE:A025820
Market Cool On Lee Ku Industrial Co., Ltd.'s (KRX:025820) Revenues Pushing Shares 34% Lower


Lee Ku Industrial Co., Ltd. (KRX:025820) shares have retraced a considerable 34% in the last month, reversing a fair amount of their solid recent performance. Looking back over the past twelve months the stock has been a solid performer regardless, with a gain of 16%.
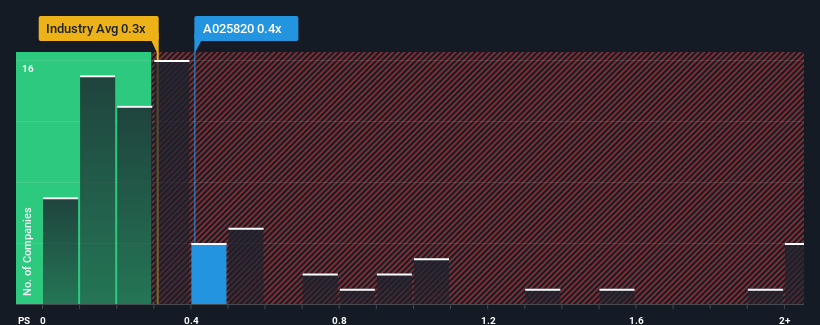
Even after such a large drop in price, it's still not a stretch to say that Lee Ku Industrial's price-to-sales (or "P/S") ratio of 0.4x right now seems quite "middle-of-the-road" compared to the Metals and Mining industry in Korea, where the median P/S ratio is around 0.3x. However, investors might be overlooking a clear opportunity or potential setback if there is no rational basis for the P/S.
View our latest analysis for Lee Ku Industrial
What Does Lee Ku Industrial's P/S Mean For Shareholders?
For example, consider that Lee Ku Industrial's financial performance has been pretty ordinary lately as revenue growth is non-existent. It might be that many expect the uninspiring revenue performance to only match most other companies at best over the coming period, which has kept the P/S from rising. If you like the company, you'd be hoping this isn't the case so that you could potentially pick up some stock while it's not quite in favour.
We don't have analyst forecasts, but you can see how recent trends are setting up the company for the future by checking out our free report on Lee Ku Industrial's earnings, revenue and cash flow.What Are Revenue Growth Metrics Telling Us About The P/S?
In order to justify its P/S ratio, Lee Ku Industrial would need to produce growth that's similar to the industry.
Retrospectively, the last year delivered virtually the same number to the company's top line as the year before. Still, the latest three year period has seen an excellent 84% overall rise in revenue, in spite of its uninspiring short-term performance. So while the company has done a solid job in the past, it's somewhat concerning to see revenue growth decline as much as it has.
Comparing that to the industry, which is only predicted to deliver 13% growth in the next 12 months, the company's momentum is stronger based on recent medium-term annualised revenue results.
In light of this, it's curious that Lee Ku Industrial's P/S sits in line with the majority of other companies. It may be that most investors are not convinced the company can maintain its recent growth rates.
The Bottom Line On Lee Ku Industrial's P/S
With its share price dropping off a cliff, the P/S for Lee Ku Industrial looks to be in line with the rest of the Metals and Mining industry. Generally, our preference is to limit the use of the price-to-sales ratio to establishing what the market thinks about the overall health of a company.
We've established that Lee Ku Industrial currently trades on a lower than expected P/S since its recent three-year growth is higher than the wider industry forecast. When we see strong revenue with faster-than-industry growth, we can only assume potential risks are what might be placing pressure on the P/S ratio. It appears some are indeed anticipating revenue instability, because the persistence of these recent medium-term conditions would normally provide a boost to the share price.
Before you take the next step, you should know about the 4 warning signs for Lee Ku Industrial (2 can't be ignored!) that we have uncovered.
If you're unsure about the strength of Lee Ku Industrial's business, why not explore our interactive list of stocks with solid business fundamentals for some other companies you may have missed.
New: AI Stock Screener & Alerts
Our new AI Stock Screener scans the market every day to uncover opportunities.
• Dividend Powerhouses (3%+ Yield)
• Undervalued Small Caps with Insider Buying
• High growth Tech and AI Companies
Or build your own from over 50 metrics.
Have feedback on this article? Concerned about the content? Get in touch with us directly. Alternatively, email editorial-team (at) simplywallst.com.
This article by Simply Wall St is general in nature. We provide commentary based on historical data and analyst forecasts only using an unbiased methodology and our articles are not intended to be financial advice. It does not constitute a recommendation to buy or sell any stock, and does not take account of your objectives, or your financial situation. We aim to bring you long-term focused analysis driven by fundamental data. Note that our analysis may not factor in the latest price-sensitive company announcements or qualitative material. Simply Wall St has no position in any stocks mentioned.
Have feedback on this article? Concerned about the content? Get in touch with us directly. Alternatively, email editorial-team@simplywallst.com
About KOSE:A025820
Lee Ku Industrial
Operates in the non-ferrous material industry in South Korea.
Solid track record with adequate balance sheet.
