Advertisement
- South Korea
- /
- Chemicals
- /
- KOSDAQ:A056700
Shinwha Intertek (KOSDAQ:056700) Has Some Difficulty Using Its Capital Effectively
When we're researching a company, it's sometimes hard to find the warning signs, but there are some financial metrics that can help spot trouble early. More often than not, we'll see a declining return on capital employed (ROCE) and a declining amount of capital employed. This combination can tell you that not only is the company investing less, it's earning less on what it does invest. So after we looked into Shinwha Intertek (KOSDAQ:056700), the trends above didn't look too great.
Understanding Return On Capital Employed (ROCE)
For those who don't know, ROCE is a measure of a company's yearly pre-tax profit (its return), relative to the capital employed in the business. Analysts use this formula to calculate it for Shinwha Intertek:
Return on Capital Employed = Earnings Before Interest and Tax (EBIT) ÷ (Total Assets - Current Liabilities)
0.061 = ₩5.8b ÷ (₩189b - ₩94b) (Based on the trailing twelve months to December 2024).
Thus, Shinwha Intertek has an ROCE of 6.1%. On its own, that's a low figure but it's around the 7.1% average generated by the Chemicals industry.
View our latest analysis for Shinwha Intertek
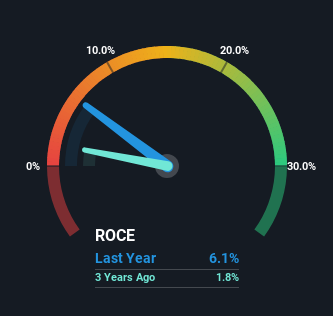
Historical performance is a great place to start when researching a stock so above you can see the gauge for Shinwha Intertek's ROCE against it's prior returns. If you'd like to look at how Shinwha Intertek has performed in the past in other metrics, you can view this free graph of Shinwha Intertek's past earnings, revenue and cash flow.
What Does the ROCE Trend For Shinwha Intertek Tell Us?
In terms of Shinwha Intertek's historical ROCE movements, the trend doesn't inspire confidence. To be more specific, the ROCE was 16% five years ago, but since then it has dropped noticeably. On top of that, it's worth noting that the amount of capital employed within the business has remained relatively steady. This combination can be indicative of a mature business that still has areas to deploy capital, but the returns received aren't as high due potentially to new competition or smaller margins. If these trends continue, we wouldn't expect Shinwha Intertek to turn into a multi-bagger.
On a separate but related note, it's important to know that Shinwha Intertek has a current liabilities to total assets ratio of 50%, which we'd consider pretty high. This can bring about some risks because the company is basically operating with a rather large reliance on its suppliers or other sorts of short-term creditors. While it's not necessarily a bad thing, it can be beneficial if this ratio is lower.
The Bottom Line On Shinwha Intertek's ROCE
In summary, it's unfortunate that Shinwha Intertek is generating lower returns from the same amount of capital. Investors haven't taken kindly to these developments, since the stock has declined 23% from where it was five years ago. Unless there is a shift to a more positive trajectory in these metrics, we would look elsewhere.
If you'd like to know more about Shinwha Intertek, we've spotted 2 warning signs, and 1 of them shouldn't be ignored.
While Shinwha Intertek may not currently earn the highest returns, we've compiled a list of companies that currently earn more than 25% return on equity. Check out this free list here.
New: Manage All Your Stock Portfolios in One Place
We've created the ultimate portfolio companion for stock investors, and it's free.
• Connect an unlimited number of Portfolios and see your total in one currency
• Be alerted to new Warning Signs or Risks via email or mobile
• Track the Fair Value of your stocks
Have feedback on this article? Concerned about the content? Get in touch with us directly. Alternatively, email editorial-team (at) simplywallst.com.
This article by Simply Wall St is general in nature. We provide commentary based on historical data and analyst forecasts only using an unbiased methodology and our articles are not intended to be financial advice. It does not constitute a recommendation to buy or sell any stock, and does not take account of your objectives, or your financial situation. We aim to bring you long-term focused analysis driven by fundamental data. Note that our analysis may not factor in the latest price-sensitive company announcements or qualitative material. Simply Wall St has no position in any stocks mentioned.
About KOSDAQ:A056700
Shinwha Intertek
Produces and sells optical films in Korea and internationally.
Excellent balance sheet and slightly overvalued.
Similar Companies
Market Insights


Advertisement
Weekly Picks
CE


Ceazar on Sparc AI ·
When GPS fails: this small cap is fixing a $54B drone problem
Fair Value:CA$5.2552.0% undervalued
121 followersusers have followed this narrative
0 commentsusers have commented on this narrative
25 likesusers have liked this narrative
BL


BlackGoat on IREN ·
IREN's Bold Moves in Sustainable Bitcoin Mining & AI Data Centers
Fair Value:US$71.4848.5% undervalued
222 followersusers have followed this narrative
9 commentsusers have commented on this narrative
33 likesusers have liked this narrative
HE


HedgeY on Arm Holdings ·
The Architecture Layer of AI Computing - But Priced Like the Future Already Arrived?
Fair Value:US$43044.3% undervalued
24 followersusers have followed this narrative
1 commentusers have commented on this narrative
7 likesusers have liked this narrative
HI


Hidden_Rock_Capital on Fiserv ·
Temporary "perfect storm" leads to opportunity to buy financial services leader for less than 5x long-term earnings
Fair Value:US$119.9955.0% undervalued
32 followersusers have followed this narrative
1 commentusers have commented on this narrative
10 likesusers have liked this narrative
Recently Updated Narratives
AL

alexandru_g3 on Alibaba Group Holding ·
One of the Most Mispriced Technology Ecosystems in the Market
Fair Value:US$241.9149.5% undervalued
1 followerusers have followed this narrative
0 commentsusers have commented on this narrative
0 likesusers have liked this narrative
AN


andre_santos on Microsoft ·
Microsoft - A Fundamental Valuation
Fair Value:US$507.348.4% undervalued
27 followersusers have followed this narrative
4 commentsusers have commented on this narrative
0 likesusers have liked this narrative
AH

AHaron on Eli Lilly ·
Eli Lilly: A Pipeline-Driven Growth Story Trading 30% Below What the Business Is Actually Worth
Fair Value:US$1.48k22.2% undervalued
42 followersusers have followed this narrative
0 commentsusers have commented on this narrative
0 likesusers have liked this narrative
Popular Narratives
OS


oscargarcia on NVIDIA ·
The company that went from selling GPUs to gamers to becoming the AI arms dealer of the 21st century.
Fair Value:US$28028.3% undervalued
223 followersusers have followed this narrative
9 commentsusers have commented on this narrative
15 likesusers have liked this narrative
CU
CubanEros on Microsoft ·
A wonderful business at reasonable price.
Fair Value:US$419.9110.7% overvalued
102 followersusers have followed this narrative
0 commentsusers have commented on this narrative
7 likesusers have liked this narrative
TR


tripledub on Alphabet ·
Warren Buffett Just Bet $10 Billion on Google. The Catch? You May Already Be Too Late.
Fair Value:US$23054.8% overvalued
118 followersusers have followed this narrative
1 commentusers have commented on this narrative
18 likesusers have liked this narrative
Trending Discussion
GR
greg_xasak on Fiserv ·
As someone who has dealt directly with them as a CTO for a credit union, I have 8 years of horror stories about doing business with them. If there was any other competitor than could deliver 80% of Fiserv services, there would be a mad rush to migrate to them. They should thank their lucky stars they are a near monopoly. this industry is so ripe for a well funded competitor. Their integration of technology is awful, their ability to fix their own implementation screwups is sadly tragic. Sometimes they just silently kill support tickets without resolution and you never find out until you do a follow up inquiry. Why, because sometimes no one you are dealing with knows how to fix it and knows no one to ask for help. They can not meet their own implementation deadlines and sometimes there is no one on a technical team dealing with you that has any banking or credit union experience. The is an industry insider phrase when you meet other Fiserv customers called being "Fiserved". It means telling others of your worst stories of dealing with them. Ask around, all CTO's have some doozies.
1
|0

