
Advertisement
- South Korea
- /
- Personal Products
- /
- KOSDAQ:A352480
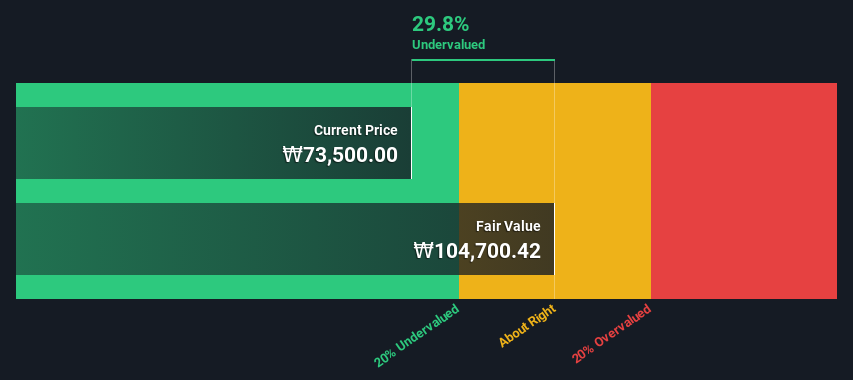
Are Investors Undervaluing C&C International Co., Ltd. (KOSDAQ:352480) By 30%?

Key Insights
- The projected fair value for C&C International is ₩104,700 based on 2 Stage Free Cash Flow to Equity
- C&C International's ₩73,500 share price signals that it might be 30% undervalued
- The ₩86,500 analyst price target for A352480 is 17% less than our estimate of fair value
Today we will run through one way of estimating the intrinsic value of C&C International Co., Ltd. (KOSDAQ:352480) by taking the expected future cash flows and discounting them to their present value. This will be done using the Discounted Cash Flow (DCF) model. Believe it or not, it's not too difficult to follow, as you'll see from our example!
We generally believe that a company's value is the present value of all of the cash it will generate in the future. However, a DCF is just one valuation metric among many, and it is not without flaws. Anyone interested in learning a bit more about intrinsic value should have a read of the Simply Wall St analysis model.
See our latest analysis for C&C International
Step By Step Through The Calculation
We're using the 2-stage growth model, which simply means we take in account two stages of company's growth. In the initial period the company may have a higher growth rate and the second stage is usually assumed to have a stable growth rate. In the first stage we need to estimate the cash flows to the business over the next ten years. Where possible we use analyst estimates, but when these aren't available we extrapolate the previous free cash flow (FCF) from the last estimate or reported value. We assume companies with shrinking free cash flow will slow their rate of shrinkage, and that companies with growing free cash flow will see their growth rate slow, over this period. We do this to reflect that growth tends to slow more in the early years than it does in later years.
Generally we assume that a dollar today is more valuable than a dollar in the future, and so the sum of these future cash flows is then discounted to today's value:
10-year free cash flow (FCF) forecast
| 2024 | 2025 | 2026 | 2027 | 2028 | 2029 | 2030 | 2031 | 2032 | 2033 | |
| Levered FCF (₩, Millions) | ₩12.3b | ₩19.0b | ₩32.0b | ₩42.7b | ₩52.9b | ₩62.2b | ₩70.3b | ₩77.3b | ₩83.2b | ₩88.2b |
| Growth Rate Estimate Source | Analyst x3 | Analyst x2 | Analyst x1 | Est @ 33.35% | Est @ 24.07% | Est @ 17.57% | Est @ 13.02% | Est @ 9.84% | Est @ 7.61% | Est @ 6.05% |
| Present Value (₩, Millions) Discounted @ 8.1% | ₩11.4k | ₩16.3k | ₩25.3k | ₩31.2k | ₩35.8k | ₩39.0k | ₩40.7k | ₩41.4k | ₩41.2k | ₩40.4k |
("Est" = FCF growth rate estimated by Simply Wall St)
Present Value of 10-year Cash Flow (PVCF) = ₩323b
The second stage is also known as Terminal Value, this is the business's cash flow after the first stage. The Gordon Growth formula is used to calculate Terminal Value at a future annual growth rate equal to the 5-year average of the 10-year government bond yield of 2.4%. We discount the terminal cash flows to today's value at a cost of equity of 8.1%.
Terminal Value (TV)= FCF2033 × (1 + g) ÷ (r – g) = ₩88b× (1 + 2.4%) ÷ (8.1%– 2.4%) = ₩1.6t
Present Value of Terminal Value (PVTV)= TV / (1 + r)10= ₩1.6t÷ ( 1 + 8.1%)10= ₩724b
The total value, or equity value, is then the sum of the present value of the future cash flows, which in this case is ₩1.0t. In the final step we divide the equity value by the number of shares outstanding. Compared to the current share price of ₩74k, the company appears a touch undervalued at a 30% discount to where the stock price trades currently. Remember though, that this is just an approximate valuation, and like any complex formula - garbage in, garbage out.
The Assumptions
We would point out that the most important inputs to a discounted cash flow are the discount rate and of course the actual cash flows. You don't have to agree with these inputs, I recommend redoing the calculations yourself and playing with them. The DCF also does not consider the possible cyclicality of an industry, or a company's future capital requirements, so it does not give a full picture of a company's potential performance. Given that we are looking at C&C International as potential shareholders, the cost of equity is used as the discount rate, rather than the cost of capital (or weighted average cost of capital, WACC) which accounts for debt. In this calculation we've used 8.1%, which is based on a levered beta of 1.074. Beta is a measure of a stock's volatility, compared to the market as a whole. We get our beta from the industry average beta of globally comparable companies, with an imposed limit between 0.8 and 2.0, which is a reasonable range for a stable business.
Moving On:
Although the valuation of a company is important, it is only one of many factors that you need to assess for a company. DCF models are not the be-all and end-all of investment valuation. Instead the best use for a DCF model is to test certain assumptions and theories to see if they would lead to the company being undervalued or overvalued. For instance, if the terminal value growth rate is adjusted slightly, it can dramatically alter the overall result. What is the reason for the share price sitting below the intrinsic value? For C&C International, we've put together three pertinent aspects you should assess:
- Risks: As an example, we've found 1 warning sign for C&C International that you need to consider before investing here.
- Future Earnings: How does A352480's growth rate compare to its peers and the wider market? Dig deeper into the analyst consensus number for the upcoming years by interacting with our free analyst growth expectation chart.
- Other High Quality Alternatives: Do you like a good all-rounder? Explore our interactive list of high quality stocks to get an idea of what else is out there you may be missing!
PS. Simply Wall St updates its DCF calculation for every South Korean stock every day, so if you want to find the intrinsic value of any other stock just search here.
New: AI Stock Screener & Alerts
Our new AI Stock Screener scans the market every day to uncover opportunities.
• Dividend Powerhouses (3%+ Yield)
• Undervalued Small Caps with Insider Buying
• High growth Tech and AI Companies
Or build your own from over 50 metrics.
Have feedback on this article? Concerned about the content? Get in touch with us directly. Alternatively, email editorial-team (at) simplywallst.com.
This article by Simply Wall St is general in nature. We provide commentary based on historical data and analyst forecasts only using an unbiased methodology and our articles are not intended to be financial advice. It does not constitute a recommendation to buy or sell any stock, and does not take account of your objectives, or your financial situation. We aim to bring you long-term focused analysis driven by fundamental data. Note that our analysis may not factor in the latest price-sensitive company announcements or qualitative material. Simply Wall St has no position in any stocks mentioned.
About KOSDAQ:A352480
C&C International
C&C International Co.,Ltd engages in the research and development, manufacture, and sale of cosmetics in Korea.
Flawless balance sheet and undervalued.
Market Insights

Advertisement
Community Narratives
Scaling up in building materials with smart M&A and growing profitability
Fair Value US$2.77|30.0% undervalued
CM
Community Contributor
Hims: The Platform Powering Personalised Healthcare
Fair Value US$114.01|51.9% undervalued
BL
Community Contributor
Undervalued lottery company with strong fundamentals
Fair Value AU$15.00|34.5% undervalued
RO
Community Contributor
Proximus, transferring money from the impatient to the patient investor
Fair Value €16.62|55.1% undervalued
AX
Community Contributor