
Advertisement
- South Korea
- /
- Healthtech
- /
- KOSDAQ:A263700
Revenues Working Against Carelabs Co.,Ltd's (KOSDAQ:263700) Share Price Following 26% Dive
Carelabs Co.,Ltd (KOSDAQ:263700) shareholders won't be pleased to see that the share price has had a very rough month, dropping 26% and undoing the prior period's positive performance. Still, a bad month hasn't completely ruined the past year with the stock gaining 46%, which is great even in a bull market.
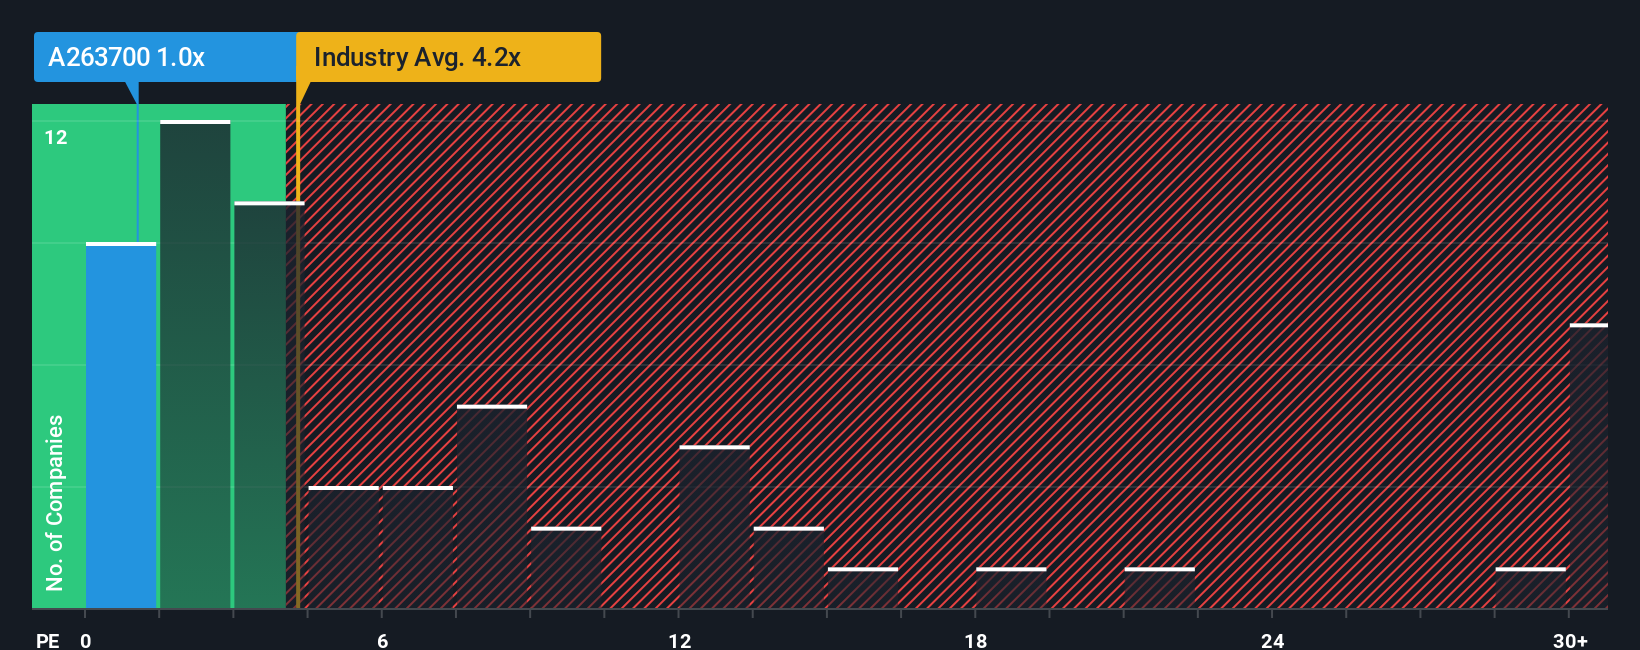
Since its price has dipped substantially, CarelabsLtd may look like a strong buying opportunity at present with its price-to-sales (or "P/S") ratio of 1x, considering almost half of all companies in the Healthcare Services industry in Korea have P/S ratios greater than 5.7x and even P/S higher than 31x aren't out of the ordinary. Nonetheless, we'd need to dig a little deeper to determine if there is a rational basis for the highly reduced P/S.
View our latest analysis for CarelabsLtd
How Has CarelabsLtd Performed Recently?
CarelabsLtd has been doing a good job lately as it's been growing revenue at a solid pace. One possibility is that the P/S is low because investors think this respectable revenue growth might actually underperform the broader industry in the near future. Those who are bullish on CarelabsLtd will be hoping that this isn't the case, so that they can pick up the stock at a lower valuation.
We don't have analyst forecasts, but you can see how recent trends are setting up the company for the future by checking out our free report on CarelabsLtd's earnings, revenue and cash flow.Do Revenue Forecasts Match The Low P/S Ratio?
There's an inherent assumption that a company should far underperform the industry for P/S ratios like CarelabsLtd's to be considered reasonable.
If we review the last year of revenue growth, the company posted a worthy increase of 8.1%. Still, lamentably revenue has fallen 7.1% in aggregate from three years ago, which is disappointing. Therefore, it's fair to say the revenue growth recently has been undesirable for the company.
Weighing that medium-term revenue trajectory against the broader industry's one-year forecast for expansion of 30% shows it's an unpleasant look.
With this in mind, we understand why CarelabsLtd's P/S is lower than most of its industry peers. However, we think shrinking revenues are unlikely to lead to a stable P/S over the longer term, which could set up shareholders for future disappointment. There's potential for the P/S to fall to even lower levels if the company doesn't improve its top-line growth.
What Does CarelabsLtd's P/S Mean For Investors?
Shares in CarelabsLtd have plummeted and its P/S has followed suit. We'd say the price-to-sales ratio's power isn't primarily as a valuation instrument but rather to gauge current investor sentiment and future expectations.
It's no surprise that CarelabsLtd maintains its low P/S off the back of its sliding revenue over the medium-term. At this stage investors feel the potential for an improvement in revenue isn't great enough to justify a higher P/S ratio. If recent medium-term revenue trends continue, it's hard to see the share price moving strongly in either direction in the near future under these circumstances.
It's always necessary to consider the ever-present spectre of investment risk. We've identified 3 warning signs with CarelabsLtd, and understanding them should be part of your investment process.
If companies with solid past earnings growth is up your alley, you may wish to see this free collection of other companies with strong earnings growth and low P/E ratios.
New: AI Stock Screener & Alerts
Our new AI Stock Screener scans the market every day to uncover opportunities.
• Dividend Powerhouses (3%+ Yield)
• Undervalued Small Caps with Insider Buying
• High growth Tech and AI Companies
Or build your own from over 50 metrics.
Have feedback on this article? Concerned about the content? Get in touch with us directly. Alternatively, email editorial-team (at) simplywallst.com.
This article by Simply Wall St is general in nature. We provide commentary based on historical data and analyst forecasts only using an unbiased methodology and our articles are not intended to be financial advice. It does not constitute a recommendation to buy or sell any stock, and does not take account of your objectives, or your financial situation. We aim to bring you long-term focused analysis driven by fundamental data. Note that our analysis may not factor in the latest price-sensitive company announcements or qualitative material. Simply Wall St has no position in any stocks mentioned.
About KOSDAQ:A263700
CarelabsLtd
Operates as a healthcare and beauty care platform company in South Korea.
Flawless balance sheet with low risk.
Market Insights

Advertisement
Community Narratives
A formidable player in AI and enterprise computing.
Fair Value US$210.00|12.2% overvalued
CO
Community Contributor
IREN's Bold Moves in Sustainable Bitcoin Mining & AI Data Centers
Fair Value US$72.52|17.1% undervalued
BL
Community Contributor
Cooling the Champions: The Aussie Tech Behind F1's Victories
Fair Value AU$12.40|38.7% undervalued
TR
Community Contributor