
Advertisement
- South Korea
- /
- Food
- /
- KOSE:A097950
Investors more bullish on CJ Cheiljedang (KRX:097950) this week as stock rallies 11%, despite earnings trending downwards over past five years

When you buy and hold a stock for the long term, you definitely want it to provide a positive return. But more than that, you probably want to see it rise more than the market average. Unfortunately for shareholders, while the CJ Cheiljedang Corporation (KRX:097950) share price is up 27% in the last five years, that's less than the market return. However, more recent buyers should be happy with the increase of 21% over the last year.
The past week has proven to be lucrative for CJ Cheiljedang investors, so let's see if fundamentals drove the company's five-year performance.
Check out our latest analysis for CJ Cheiljedang
While markets are a powerful pricing mechanism, share prices reflect investor sentiment, not just underlying business performance. One flawed but reasonable way to assess how sentiment around a company has changed is to compare the earnings per share (EPS) with the share price.
CJ Cheiljedang's earnings per share are down 11% per year, despite strong share price performance over five years.
The strong decline in earnings per share suggests the market isn't using EPS to judge the company. The falling EPS doesn't correlate with the climbing share price, so it's worth taking a look at other metrics.
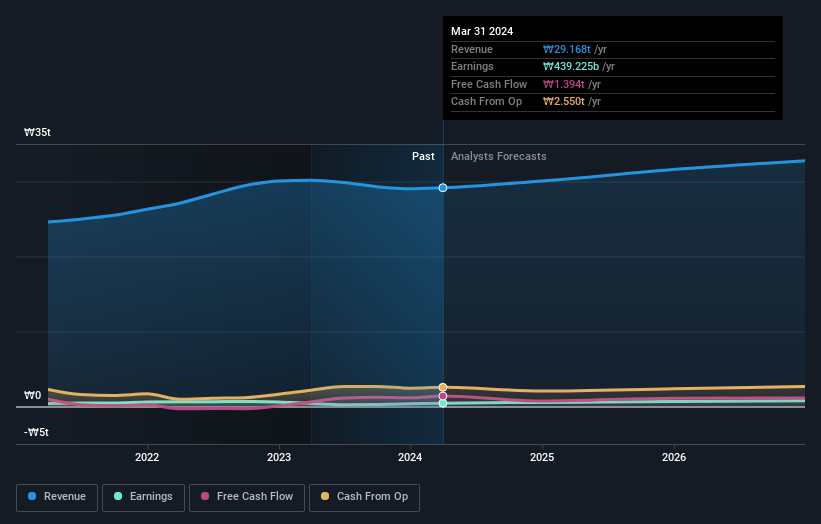
The modest 1.4% dividend yield is unlikely to be propping up the share price. On the other hand, CJ Cheiljedang's revenue is growing nicely, at a compound rate of 8.2% over the last five years. It's quite possible that management are prioritizing revenue growth over EPS growth at the moment.
You can see how earnings and revenue have changed over time in the image below (click on the chart to see the exact values).
CJ Cheiljedang is a well known stock, with plenty of analyst coverage, suggesting some visibility into future growth. So it makes a lot of sense to check out what analysts think CJ Cheiljedang will earn in the future (free analyst consensus estimates)
What About Dividends?
It is important to consider the total shareholder return, as well as the share price return, for any given stock. Whereas the share price return only reflects the change in the share price, the TSR includes the value of dividends (assuming they were reinvested) and the benefit of any discounted capital raising or spin-off. It's fair to say that the TSR gives a more complete picture for stocks that pay a dividend. We note that for CJ Cheiljedang the TSR over the last 5 years was 36%, which is better than the share price return mentioned above. This is largely a result of its dividend payments!
A Different Perspective
We're pleased to report that CJ Cheiljedang shareholders have received a total shareholder return of 24% over one year. That's including the dividend. Since the one-year TSR is better than the five-year TSR (the latter coming in at 6% per year), it would seem that the stock's performance has improved in recent times. In the best case scenario, this may hint at some real business momentum, implying that now could be a great time to delve deeper. I find it very interesting to look at share price over the long term as a proxy for business performance. But to truly gain insight, we need to consider other information, too. To that end, you should be aware of the 2 warning signs we've spotted with CJ Cheiljedang .
But note: CJ Cheiljedang may not be the best stock to buy. So take a peek at this free list of interesting companies with past earnings growth (and further growth forecast).
Please note, the market returns quoted in this article reflect the market weighted average returns of stocks that currently trade on South Korean exchanges.
New: AI Stock Screener & Alerts
Our new AI Stock Screener scans the market every day to uncover opportunities.
• Dividend Powerhouses (3%+ Yield)
• Undervalued Small Caps with Insider Buying
• High growth Tech and AI Companies
Or build your own from over 50 metrics.
Have feedback on this article? Concerned about the content? Get in touch with us directly. Alternatively, email editorial-team (at) simplywallst.com.
This article by Simply Wall St is general in nature. We provide commentary based on historical data and analyst forecasts only using an unbiased methodology and our articles are not intended to be financial advice. It does not constitute a recommendation to buy or sell any stock, and does not take account of your objectives, or your financial situation. We aim to bring you long-term focused analysis driven by fundamental data. Note that our analysis may not factor in the latest price-sensitive company announcements or qualitative material. Simply Wall St has no position in any stocks mentioned.
Have feedback on this article? Concerned about the content? Get in touch with us directly. Alternatively, email editorial-team@simplywallst.com
About KOSE:A097950
CJ Cheiljedang
Engages food and bio businesses in South Korea and internationally.
Excellent balance sheet and fair value.
Similar Companies
Market Insights

Advertisement
Community Narratives
Pinterest will surge as advertising innovations ignite revenue growth
Fair Value US$42.63|26.3% undervalued
BR
Community Contributor
Brambles' Revenue Set to Climb 14% with Profit Margins Following
Fair Value AU$21.90|4.8% overvalued
RO
Community Contributor
Challenging Future for STG as Organic Sales Decline by 8.8%
Fair Value DKK 116.13|26.8% undervalued
KA
Community Contributor