
Advertisement
- South Korea
- /
- Consumer Finance
- /
- KOSDAQ:A012700
Shareholders 29% loss in LEADCORP (KOSDAQ:012700) partly attributable to the company's decline in earnings over past three years

This month, we saw the The LEADCORP, Inc. (KOSDAQ:012700) up an impressive 36%. But that doesn't help the fact that the three year return is less impressive. In fact, the share price is down 42% in the last three years, falling well short of the market return.
While the last three years has been tough for LEADCORP shareholders, this past week has shown signs of promise. So let's look at the longer term fundamentals and see if they've been the driver of the negative returns.
Our free stock report includes 5 warning signs investors should be aware of before investing in LEADCORP. Read for free now.In his essay The Superinvestors of Graham-and-Doddsville Warren Buffett described how share prices do not always rationally reflect the value of a business. One way to examine how market sentiment has changed over time is to look at the interaction between a company's share price and its earnings per share (EPS).
During five years of share price growth, LEADCORP moved from a loss to profitability. That would generally be considered a positive, so we are surprised to see the share price is down. So given the share price is down it's worth checking some other metrics too.
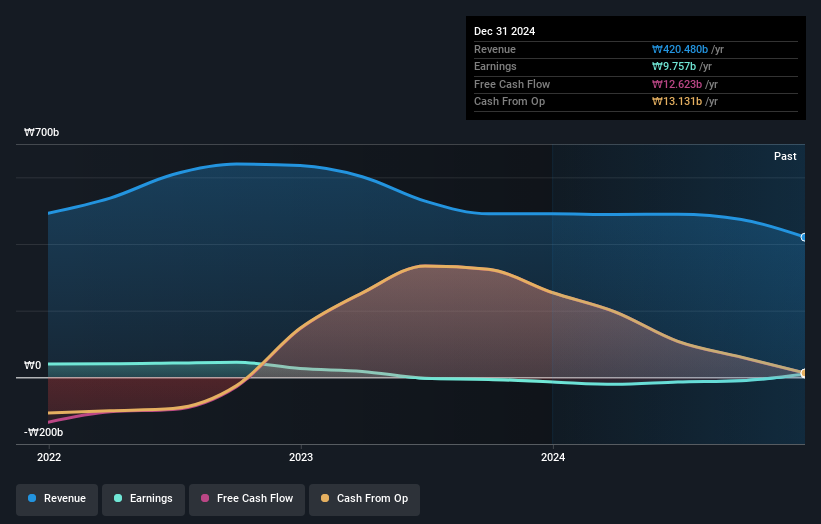
The modest 1.9% dividend yield is unlikely to be guiding the market view of the stock. We think that the revenue decline over three years, at a rate of 8.6% per year, probably had some shareholders looking to sell. And that's not surprising, since it seems unlikely that EPS growth can continue for long in the absence of revenue growth.
The image below shows how earnings and revenue have tracked over time (if you click on the image you can see greater detail).
Balance sheet strength is crucial. It might be well worthwhile taking a look at our free report on how its financial position has changed over time.
What About Dividends?
It is important to consider the total shareholder return, as well as the share price return, for any given stock. The TSR incorporates the value of any spin-offs or discounted capital raisings, along with any dividends, based on the assumption that the dividends are reinvested. Arguably, the TSR gives a more comprehensive picture of the return generated by a stock. As it happens, LEADCORP's TSR for the last 3 years was -29%, which exceeds the share price return mentioned earlier. The dividends paid by the company have thusly boosted the total shareholder return.
A Different Perspective
While it's never nice to take a loss, LEADCORP shareholders can take comfort that , including dividends,their trailing twelve month loss of 0.6% wasn't as bad as the market loss of around 3.9%. Of course, the long term returns are far more important and the good news is that over five years, the stock has returned 5% for each year. It could be that the business is just facing some short term problems, but shareholders should keep a close eye on the fundamentals. It's always interesting to track share price performance over the longer term. But to understand LEADCORP better, we need to consider many other factors. Case in point: We've spotted 5 warning signs for LEADCORP you should be aware of, and 2 of them are a bit concerning.
Of course LEADCORP may not be the best stock to buy. So you may wish to see this free collection of growth stocks.
Please note, the market returns quoted in this article reflect the market weighted average returns of stocks that currently trade on South Korean exchanges.
New: AI Stock Screener & Alerts
Our new AI Stock Screener scans the market every day to uncover opportunities.
• Dividend Powerhouses (3%+ Yield)
• Undervalued Small Caps with Insider Buying
• High growth Tech and AI Companies
Or build your own from over 50 metrics.
Have feedback on this article? Concerned about the content? Get in touch with us directly. Alternatively, email editorial-team (at) simplywallst.com.
This article by Simply Wall St is general in nature. We provide commentary based on historical data and analyst forecasts only using an unbiased methodology and our articles are not intended to be financial advice. It does not constitute a recommendation to buy or sell any stock, and does not take account of your objectives, or your financial situation. We aim to bring you long-term focused analysis driven by fundamental data. Note that our analysis may not factor in the latest price-sensitive company announcements or qualitative material. Simply Wall St has no position in any stocks mentioned.
About KOSDAQ:A012700
Moderate second-rate dividend payer.
Market Insights

Advertisement
Community Narratives

Apple: A Dying Star with an Overpriced Valuation
Fair Value US$177.34|19.2% overvalued
IN
Community Contributor
Avino a case for USD$20 per share within 5 years (assuming $3,500 gold, $100 silver and $4 copper).
Fair Value CA$26.79|86.0% undervalued
AG
Community Contributor
Riding the Defense Boom RENK Sees Revenue Climb at 15% CAGR by FY 2029
Fair Value €69.87|20.5% undervalued
CH
Community Contributor