- South Korea
- /
- Auto Components
- /
- KOSDAQ:A087260
Calculating The Fair Value Of Mobile Appliance, Inc. (KOSDAQ:087260)

Key Insights
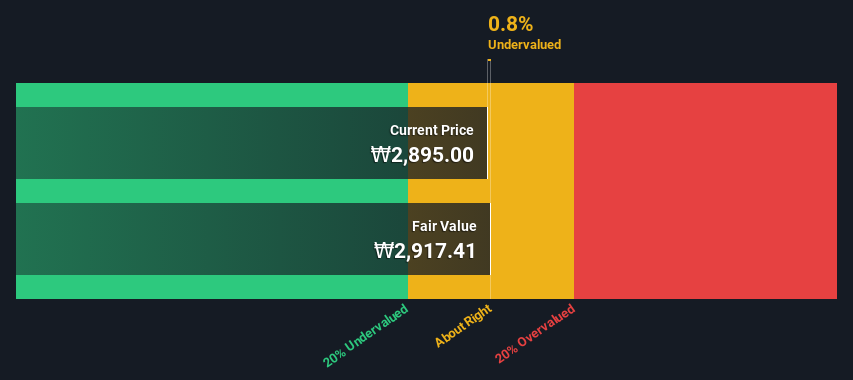
- The projected fair value for Mobile Appliance is ₩2,917 based on 2 Stage Free Cash Flow to Equity
- With ₩2,895 share price, Mobile Appliance appears to be trading close to its estimated fair value
- Mobile Appliance's peers seem to be trading at a higher discount to fair value based onthe industry average of 34%
Today we'll do a simple run through of a valuation method used to estimate the attractiveness of Mobile Appliance, Inc. (KOSDAQ:087260) as an investment opportunity by estimating the company's future cash flows and discounting them to their present value. One way to achieve this is by employing the Discounted Cash Flow (DCF) model. Before you think you won't be able to understand it, just read on! It's actually much less complex than you'd imagine.
Remember though, that there are many ways to estimate a company's value, and a DCF is just one method. If you still have some burning questions about this type of valuation, take a look at the Simply Wall St analysis model.
Check out our latest analysis for Mobile Appliance
Is Mobile Appliance Fairly Valued?
We use what is known as a 2-stage model, which simply means we have two different periods of growth rates for the company's cash flows. Generally the first stage is higher growth, and the second stage is a lower growth phase. In the first stage we need to estimate the cash flows to the business over the next ten years. Seeing as no analyst estimates of free cash flow are available to us, we have extrapolate the previous free cash flow (FCF) from the company's last reported value. We assume companies with shrinking free cash flow will slow their rate of shrinkage, and that companies with growing free cash flow will see their growth rate slow, over this period. We do this to reflect that growth tends to slow more in the early years than it does in later years.
Generally we assume that a dollar today is more valuable than a dollar in the future, so we need to discount the sum of these future cash flows to arrive at a present value estimate:
10-year free cash flow (FCF) estimate
| 2024 | 2025 | 2026 | 2027 | 2028 | 2029 | 2030 | 2031 | 2032 | 2033 | |
| Levered FCF (₩, Millions) | ₩6.04b | ₩6.40b | ₩6.71b | ₩6.99b | ₩7.25b | ₩7.48b | ₩7.71b | ₩7.93b | ₩8.14b | ₩8.35b |
| Growth Rate Estimate Source | Est @ 7.49% | Est @ 5.97% | Est @ 4.90% | Est @ 4.15% | Est @ 3.63% | Est @ 3.26% | Est @ 3.01% | Est @ 2.83% | Est @ 2.70% | Est @ 2.62% |
| Present Value (₩, Millions) Discounted @ 9.4% | ₩5.5k | ₩5.3k | ₩5.1k | ₩4.9k | ₩4.6k | ₩4.4k | ₩4.1k | ₩3.9k | ₩3.6k | ₩3.4k |
("Est" = FCF growth rate estimated by Simply Wall St)
Present Value of 10-year Cash Flow (PVCF) = ₩45b
After calculating the present value of future cash flows in the initial 10-year period, we need to calculate the Terminal Value, which accounts for all future cash flows beyond the first stage. For a number of reasons a very conservative growth rate is used that cannot exceed that of a country's GDP growth. In this case we have used the 5-year average of the 10-year government bond yield (2.4%) to estimate future growth. In the same way as with the 10-year 'growth' period, we discount future cash flows to today's value, using a cost of equity of 9.4%.
Terminal Value (TV)= FCF2033 × (1 + g) ÷ (r – g) = ₩8.4b× (1 + 2.4%) ÷ (9.4%– 2.4%) = ₩123b
Present Value of Terminal Value (PVTV)= TV / (1 + r)10= ₩123b÷ ( 1 + 9.4%)10= ₩50b
The total value, or equity value, is then the sum of the present value of the future cash flows, which in this case is ₩95b. The last step is to then divide the equity value by the number of shares outstanding. Compared to the current share price of ₩2.9k, the company appears about fair value at a 0.8% discount to where the stock price trades currently. Remember though, that this is just an approximate valuation, and like any complex formula - garbage in, garbage out.
The Assumptions
The calculation above is very dependent on two assumptions. The first is the discount rate and the other is the cash flows. If you don't agree with these result, have a go at the calculation yourself and play with the assumptions. The DCF also does not consider the possible cyclicality of an industry, or a company's future capital requirements, so it does not give a full picture of a company's potential performance. Given that we are looking at Mobile Appliance as potential shareholders, the cost of equity is used as the discount rate, rather than the cost of capital (or weighted average cost of capital, WACC) which accounts for debt. In this calculation we've used 9.4%, which is based on a levered beta of 1.310. Beta is a measure of a stock's volatility, compared to the market as a whole. We get our beta from the industry average beta of globally comparable companies, with an imposed limit between 0.8 and 2.0, which is a reasonable range for a stable business.
SWOT Analysis for Mobile Appliance
- Debt is well covered by cash flow.
- Earnings declined over the past year.
- Interest payments on debt are not well covered.
- Current share price is below our estimate of fair value.
- Lack of analyst coverage makes it difficult to determine A087260's earnings prospects.
- No apparent threats visible for A087260.
Moving On:
Whilst important, the DCF calculation is only one of many factors that you need to assess for a company. The DCF model is not a perfect stock valuation tool. Instead the best use for a DCF model is to test certain assumptions and theories to see if they would lead to the company being undervalued or overvalued. For example, changes in the company's cost of equity or the risk free rate can significantly impact the valuation. For Mobile Appliance, there are three further aspects you should consider:
- Risks: For example, we've discovered 2 warning signs for Mobile Appliance that you should be aware of before investing here.
- Other High Quality Alternatives: Do you like a good all-rounder? Explore our interactive list of high quality stocks to get an idea of what else is out there you may be missing!
- Other Top Analyst Picks: Interested to see what the analysts are thinking? Take a look at our interactive list of analysts' top stock picks to find out what they feel might have an attractive future outlook!
PS. The Simply Wall St app conducts a discounted cash flow valuation for every stock on the KOSDAQ every day. If you want to find the calculation for other stocks just search here.
Mobile Infrastructure for Defense and Disaster
The next wave in robotics isn't humanoid. Its fully autonomous towers delivering 5G, ISR, and radar in under 30 minutes, anywhere.
Get the investor briefing before the next round of contracts
Sponsored On Behalf of CiTechNew: Manage All Your Stock Portfolios in One Place
We've created the ultimate portfolio companion for stock investors, and it's free.
• Connect an unlimited number of Portfolios and see your total in one currency
• Be alerted to new Warning Signs or Risks via email or mobile
• Track the Fair Value of your stocks
Have feedback on this article? Concerned about the content? Get in touch with us directly. Alternatively, email editorial-team (at) simplywallst.com.
This article by Simply Wall St is general in nature. We provide commentary based on historical data and analyst forecasts only using an unbiased methodology and our articles are not intended to be financial advice. It does not constitute a recommendation to buy or sell any stock, and does not take account of your objectives, or your financial situation. We aim to bring you long-term focused analysis driven by fundamental data. Note that our analysis may not factor in the latest price-sensitive company announcements or qualitative material. Simply Wall St has no position in any stocks mentioned.
About KOSDAQ:A087260
Mobile Appliance
Develops, manufactures, and exports car safety devices in South Korea and internationally.
Flawless balance sheet with solid track record.
Market Insights

Weekly Picks

THE KINGDOM OF BROWN GOODS: WHY MGPI IS BEING CRUSHED BY INVENTORY & PRIMED FOR RESURRECTION


Why Vertical Aerospace (NYSE: EVTL) is Worth Possibly Over 13x its Current Price


The Quiet Giant That Became AI’s Power Grid
Recently Updated Narratives


A case for CA$31.80 (undiluted), aka 8,616% upside from CA$0.37 (an 86 bagger!).


Unicycive Therapeutics (Nasdaq: UNCY) – Preparing for a Second Shot at Bringing a New Kidney Treatment to Market (TEST)

Rocket Lab USA Will Ignite a 30% Revenue Growth Journey
Popular Narratives


MicroVision will explode future revenue by 380.37% with a vision towards success


NVDA: Expanding AI Demand Will Drive Major Data Center Investments Through 2026


Crazy Undervalued 42 Baggers Silver Play (Active & Running Mine)
Trending Discussion