- South Korea
- /
- Electrical
- /
- KOSE:A011690
A Piece Of The Puzzle Missing From Y2 Solution Co., Ltd's (KRX:011690) 26% Share Price Climb

Y2 Solution Co., Ltd (KRX:011690) shares have continued their recent momentum with a 26% gain in the last month alone. Not all shareholders will be feeling jubilant, since the share price is still down a very disappointing 35% in the last twelve months.
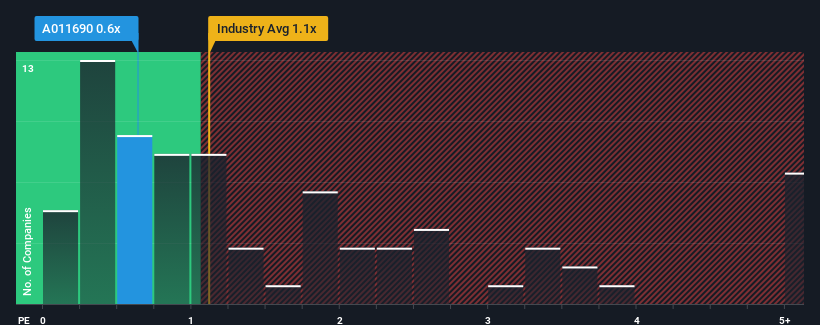
Even after such a large jump in price, there still wouldn't be many who think Y2 Solution's price-to-sales (or "P/S") ratio of 0.6x is worth a mention when the median P/S in Korea's Electrical industry is similar at about 1.1x. However, investors might be overlooking a clear opportunity or potential setback if there is no rational basis for the P/S.
We've discovered 3 warning signs about Y2 Solution. View them for free.See our latest analysis for Y2 Solution
How Has Y2 Solution Performed Recently?
Y2 Solution certainly has been doing a great job lately as it's been growing its revenue at a really rapid pace. Perhaps the market is expecting future revenue performance to taper off, which has kept the P/S from rising. Those who are bullish on Y2 Solution will be hoping that this isn't the case, so that they can pick up the stock at a lower valuation.
Want the full picture on earnings, revenue and cash flow for the company? Then our free report on Y2 Solution will help you shine a light on its historical performance.How Is Y2 Solution's Revenue Growth Trending?
The only time you'd be comfortable seeing a P/S like Y2 Solution's is when the company's growth is tracking the industry closely.
Taking a look back first, we see that the company grew revenue by an impressive 38% last year. The latest three year period has also seen an excellent 58% overall rise in revenue, aided by its short-term performance. Therefore, it's fair to say the revenue growth recently has been superb for the company.
Comparing that to the industry, which is only predicted to deliver 12% growth in the next 12 months, the company's momentum is stronger based on recent medium-term annualised revenue results.
In light of this, it's curious that Y2 Solution's P/S sits in line with the majority of other companies. Apparently some shareholders believe the recent performance is at its limits and have been accepting lower selling prices.
What Does Y2 Solution's P/S Mean For Investors?
Its shares have lifted substantially and now Y2 Solution's P/S is back within range of the industry median. It's argued the price-to-sales ratio is an inferior measure of value within certain industries, but it can be a powerful business sentiment indicator.
To our surprise, Y2 Solution revealed its three-year revenue trends aren't contributing to its P/S as much as we would have predicted, given they look better than current industry expectations. When we see strong revenue with faster-than-industry growth, we can only assume potential risks are what might be placing pressure on the P/S ratio. While recent revenue trends over the past medium-term suggest that the risk of a price decline is low, investors appear to see the likelihood of revenue fluctuations in the future.
There are also other vital risk factors to consider before investing and we've discovered 3 warning signs for Y2 Solution that you should be aware of.
If strong companies turning a profit tickle your fancy, then you'll want to check out this free list of interesting companies that trade on a low P/E (but have proven they can grow earnings).
The New Payments ETF Is Live on NASDAQ:
Money is moving to real-time rails, and a newly listed ETF now gives investors direct exposure. Fast settlement. Institutional custody. Simple access.
Explore how this launch could reshape portfolios
Sponsored ContentNew: Manage All Your Stock Portfolios in One Place
We've created the ultimate portfolio companion for stock investors, and it's free.
• Connect an unlimited number of Portfolios and see your total in one currency
• Be alerted to new Warning Signs or Risks via email or mobile
• Track the Fair Value of your stocks
Have feedback on this article? Concerned about the content? Get in touch with us directly. Alternatively, email editorial-team (at) simplywallst.com.
This article by Simply Wall St is general in nature. We provide commentary based on historical data and analyst forecasts only using an unbiased methodology and our articles are not intended to be financial advice. It does not constitute a recommendation to buy or sell any stock, and does not take account of your objectives, or your financial situation. We aim to bring you long-term focused analysis driven by fundamental data. Note that our analysis may not factor in the latest price-sensitive company announcements or qualitative material. Simply Wall St has no position in any stocks mentioned.
About KOSE:A011690
Y2 Solution
Provides TV power supply and LED lighting services in South Korea.
Flawless balance sheet and good value.
Market Insights

Weekly Picks

THE KINGDOM OF BROWN GOODS: WHY MGPI IS BEING CRUSHED BY INVENTORY & PRIMED FOR RESURRECTION


Why Vertical Aerospace (NYSE: EVTL) is Worth Possibly Over 13x its Current Price


The Quiet Giant That Became AI’s Power Grid
Recently Updated Narratives


MINISO's fair value is projected at 26.69 with an anticipated PE ratio shift of 20x

Fiverr International will transform the freelance industry with AI-powered growth

Stride Stock: Online Education Finds Its Second Act
Popular Narratives


MicroVision will explode future revenue by 380.37% with a vision towards success


Crazy Undervalued 42 Baggers Silver Play (Active & Running Mine)


