- South Korea
- /
- Electrical
- /
- KOSDAQ:A273640
Do Its Financials Have Any Role To Play In Driving YM Tech Co., Ltd.'s (KOSDAQ:273640) Stock Up Recently?

YM Tech (KOSDAQ:273640) has had a great run on the share market with its stock up by a significant 12% over the last month. As most would know, fundamentals are what usually guide market price movements over the long-term, so we decided to look at the company's key financial indicators today to determine if they have any role to play in the recent price movement. Particularly, we will be paying attention to YM Tech's ROE today.
Return on equity or ROE is a key measure used to assess how efficiently a company's management is utilizing the company's capital. In simpler terms, it measures the profitability of a company in relation to shareholder's equity.
Check out our latest analysis for YM Tech
How Do You Calculate Return On Equity?
Return on equity can be calculated by using the formula:
Return on Equity = Net Profit (from continuing operations) ÷ Shareholders' Equity
So, based on the above formula, the ROE for YM Tech is:
7.1% = ₩4.1b ÷ ₩58b (Based on the trailing twelve months to September 2024).
The 'return' is the profit over the last twelve months. So, this means that for every ₩1 of its shareholder's investments, the company generates a profit of ₩0.07.
What Has ROE Got To Do With Earnings Growth?
We have already established that ROE serves as an efficient profit-generating gauge for a company's future earnings. Depending on how much of these profits the company reinvests or "retains", and how effectively it does so, we are then able to assess a company’s earnings growth potential. Generally speaking, other things being equal, firms with a high return on equity and profit retention, have a higher growth rate than firms that don’t share these attributes.
YM Tech's Earnings Growth And 7.1% ROE
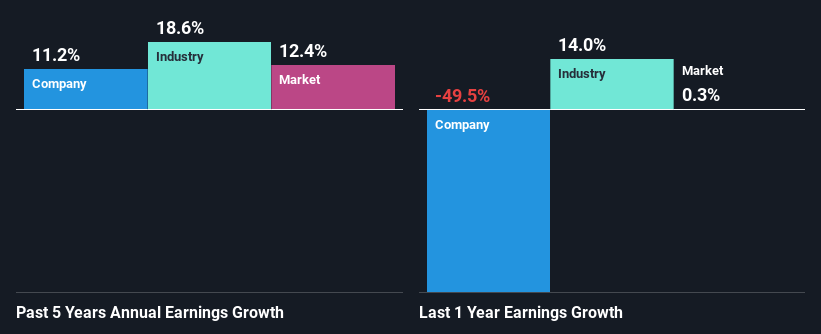
At first glance, YM Tech's ROE doesn't look very promising. However, given that the company's ROE is similar to the average industry ROE of 8.3%, we may spare it some thought. Having said that, YM Tech has shown a modest net income growth of 11% over the past five years. Given the slightly low ROE, it is likely that there could be some other aspects that are driving this growth. For example, it is possible that the company's management has made some good strategic decisions, or that the company has a low payout ratio.
As a next step, we compared YM Tech's net income growth with the industry and were disappointed to see that the company's growth is lower than the industry average growth of 19% in the same period.
The basis for attaching value to a company is, to a great extent, tied to its earnings growth. What investors need to determine next is if the expected earnings growth, or the lack of it, is already built into the share price. By doing so, they will have an idea if the stock is headed into clear blue waters or if swampy waters await. Is YM Tech fairly valued compared to other companies? These 3 valuation measures might help you decide.
Is YM Tech Efficiently Re-investing Its Profits?
Summary
On the whole, we do feel that YM Tech has some positive attributes. Specifically, its fairly high earnings growth number, which no doubt was backed by the company's high earnings retention. Still, the low ROE means that all that reinvestment is not reaping a lot of benefit to the investors. While we won't completely dismiss the company, what we would do, is try to ascertain how risky the business is to make a more informed decision around the company. Our risks dashboard will have the 1 risk we have identified for YM Tech.
The New Payments ETF Is Live on NASDAQ:
Money is moving to real-time rails, and a newly listed ETF now gives investors direct exposure. Fast settlement. Institutional custody. Simple access.
Explore how this launch could reshape portfolios
Sponsored ContentNew: Manage All Your Stock Portfolios in One Place
We've created the ultimate portfolio companion for stock investors, and it's free.
• Connect an unlimited number of Portfolios and see your total in one currency
• Be alerted to new Warning Signs or Risks via email or mobile
• Track the Fair Value of your stocks
Have feedback on this article? Concerned about the content? Get in touch with us directly. Alternatively, email editorial-team (at) simplywallst.com.
This article by Simply Wall St is general in nature. We provide commentary based on historical data and analyst forecasts only using an unbiased methodology and our articles are not intended to be financial advice. It does not constitute a recommendation to buy or sell any stock, and does not take account of your objectives, or your financial situation. We aim to bring you long-term focused analysis driven by fundamental data. Note that our analysis may not factor in the latest price-sensitive company announcements or qualitative material. Simply Wall St has no position in any stocks mentioned.
About KOSDAQ:A273640
Flawless balance sheet with acceptable track record.
Market Insights

Weekly Picks

THE KINGDOM OF BROWN GOODS: WHY MGPI IS BEING CRUSHED BY INVENTORY & PRIMED FOR RESURRECTION


Why Vertical Aerospace (NYSE: EVTL) is Worth Possibly Over 13x its Current Price


The Quiet Giant That Became AI’s Power Grid
Recently Updated Narratives


A case for USD $14.81 per share based on book value. Be warned, this is a micro-cap dependent on a single mine.

Occidental Petroleum to Become Fairly Priced at $68.29 According to Future Projections

Agfa-Gevaert is a digital and materials turnaround opportunity, with growth potential in ZIRFON, but carrying legacy risks.
Popular Narratives


MicroVision will explode future revenue by 380.37% with a vision towards success


Crazy Undervalued 42 Baggers Silver Play (Active & Running Mine)


