
Advertisement
- South Korea
- /
- Auto Components
- /
- KOSE:A047400
Does Union Materials (KRX:047400) Have A Healthy Balance Sheet?
Some say volatility, rather than debt, is the best way to think about risk as an investor, but Warren Buffett famously said that 'Volatility is far from synonymous with risk.' When we think about how risky a company is, we always like to look at its use of debt, since debt overload can lead to ruin. We note that Union Materials Corp. (KRX:047400) does have debt on its balance sheet. But should shareholders be worried about its use of debt?
What Risk Does Debt Bring?
Debt and other liabilities become risky for a business when it cannot easily fulfill those obligations, either with free cash flow or by raising capital at an attractive price. Part and parcel of capitalism is the process of 'creative destruction' where failed businesses are mercilessly liquidated by their bankers. However, a more usual (but still expensive) situation is where a company must dilute shareholders at a cheap share price simply to get debt under control. Having said that, the most common situation is where a company manages its debt reasonably well - and to its own advantage. The first thing to do when considering how much debt a business uses is to look at its cash and debt together.
See our latest analysis for Union Materials
How Much Debt Does Union Materials Carry?
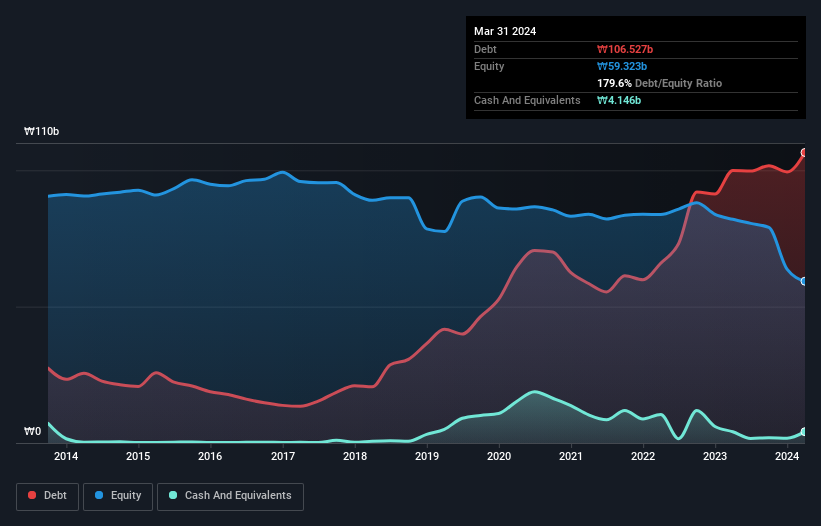
You can click the graphic below for the historical numbers, but it shows that as of March 2024 Union Materials had ₩106.5b of debt, an increase on ₩99.9b, over one year. However, it also had ₩4.15b in cash, and so its net debt is ₩102.4b.
How Healthy Is Union Materials' Balance Sheet?
We can see from the most recent balance sheet that Union Materials had liabilities of ₩106.5b falling due within a year, and liabilities of ₩22.6b due beyond that. Offsetting this, it had ₩4.15b in cash and ₩46.0b in receivables that were due within 12 months. So its liabilities outweigh the sum of its cash and (near-term) receivables by ₩79.0b.
This deficit is considerable relative to its market capitalization of ₩120.5b, so it does suggest shareholders should keep an eye on Union Materials' use of debt. Should its lenders demand that it shore up the balance sheet, shareholders would likely face severe dilution. The balance sheet is clearly the area to focus on when you are analysing debt. But it is Union Materials's earnings that will influence how the balance sheet holds up in the future. So if you're keen to discover more about its earnings, it might be worth checking out this graph of its long term earnings trend.
Over 12 months, Union Materials made a loss at the EBIT level, and saw its revenue drop to ₩117b, which is a fall of 3.8%. That's not what we would hope to see.
Caveat Emptor
Importantly, Union Materials had an earnings before interest and tax (EBIT) loss over the last year. Indeed, it lost ₩8.6b at the EBIT level. When we look at that and recall the liabilities on its balance sheet, relative to cash, it seems unwise to us for the company to have any debt. Quite frankly we think the balance sheet is far from match-fit, although it could be improved with time. We would feel better if it turned its trailing twelve month loss of ₩22b into a profit. So to be blunt we do think it is risky. There's no doubt that we learn most about debt from the balance sheet. However, not all investment risk resides within the balance sheet - far from it. For example Union Materials has 4 warning signs (and 2 which don't sit too well with us) we think you should know about.
Of course, if you're the type of investor who prefers buying stocks without the burden of debt, then don't hesitate to discover our exclusive list of net cash growth stocks, today.
New: AI Stock Screener & Alerts
Our new AI Stock Screener scans the market every day to uncover opportunities.
• Dividend Powerhouses (3%+ Yield)
• Undervalued Small Caps with Insider Buying
• High growth Tech and AI Companies
Or build your own from over 50 metrics.
Have feedback on this article? Concerned about the content? Get in touch with us directly. Alternatively, email editorial-team (at) simplywallst.com.
This article by Simply Wall St is general in nature. We provide commentary based on historical data and analyst forecasts only using an unbiased methodology and our articles are not intended to be financial advice. It does not constitute a recommendation to buy or sell any stock, and does not take account of your objectives, or your financial situation. We aim to bring you long-term focused analysis driven by fundamental data. Note that our analysis may not factor in the latest price-sensitive company announcements or qualitative material. Simply Wall St has no position in any stocks mentioned.
Have feedback on this article? Concerned about the content? Get in touch with us directly. Alternatively, email editorial-team@simplywallst.com
About KOSE:A047400
Union Materials
Manufactures and sells ferrite magnets for motors in South Korea and internationally.
Mediocre balance sheet with low risk.
Market Insights

Advertisement
Community Narratives
MicroVision will explode future revenue by 380.37% with a vision towards success
Fair Value US$60|98.4% undervalued
TH
Community Contributor
The Indispensable Artery for a New North American Economy
Fair Value CA$132.87|0.7% overvalued
TI
Community Contributor
Recently Updated Narratives
CO

composite32 on Astor Enerji ·
Astor Enerji will surge with a fair value of $140.43 in the next 3 years
Fair Value:₺140.4335.5% undervalued
1 followerusers have followed this narrative
0 commentsusers have commented on this narrative
0 likesusers have liked this narrative
RE

RecMag on Proximus ·
Proximus: The State-Backed Backup Plan with 7% Gross Yield and 15% Currency Upside.
Fair Value:€17.1356.7% undervalued
30 followersusers have followed this narrative
0 commentsusers have commented on this narrative
0 likesusers have liked this narrative
AG


Agricola on IMPACT Silver ·
A case for for IMPACT Silver Corp (TSXV:IPT) to reach USD $4.52 (CAD $6.16) in 2026 (23 bagger in 1 year) and USD $5.76 (CAD $7.89) by 2030
Fair Value:CA$7.8996.2% undervalued
1 followerusers have followed this narrative
0 commentsusers have commented on this narrative
0 likesusers have liked this narrative
Popular Narratives
TH

TheWallstreetKing on MicroVision ·
MicroVision will explode future revenue by 380.37% with a vision towards success
Fair Value:US$6098.4% undervalued
101 followersusers have followed this narrative
10 commentsusers have commented on this narrative
20 likesusers have liked this narrative
OS


oscargarcia on Alphabet ·
The company that turned a verb into a global necessity and basically runs the modern internet, digital ads, smartphones, maps, and AI.
Fair Value:US$3405.8% undervalued
138 followersusers have followed this narrative
6 commentsusers have commented on this narrative
18 likesusers have liked this narrative
AN


AnalystConsensusTarget on NVIDIA ·
NVDA: Expanding AI Demand Will Drive Major Data Center Investments Through 2026
Fair Value:US$250.3929.3% undervalued
931 followersusers have followed this narrative
6 commentsusers have commented on this narrative
23 likesusers have liked this narrative