
Advertisement
- South Korea
- /
- Auto Components
- /
- KOSDAQ:A123410
A Look At The Fair Value Of Korea Fuel-Tech Corporation (KOSDAQ:123410)

Key Insights
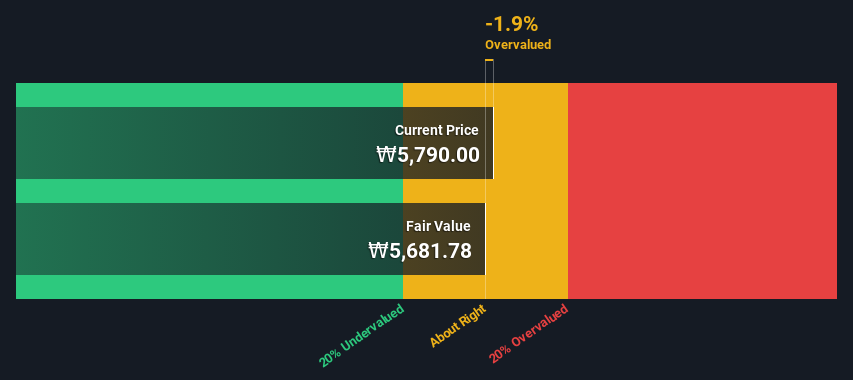
- The projected fair value for Korea Fuel-Tech is ₩5,682 based on 2 Stage Free Cash Flow to Equity
- Current share price of ₩5,790 suggests Korea Fuel-Tech is potentially trading close to its fair value
- When compared to theindustry average discount of -58%, Korea Fuel-Tech's competitors seem to be trading at a greater premium to fair value
Today we will run through one way of estimating the intrinsic value of Korea Fuel-Tech Corporation (KOSDAQ:123410) by taking the forecast future cash flows of the company and discounting them back to today's value. We will take advantage of the Discounted Cash Flow (DCF) model for this purpose. Believe it or not, it's not too difficult to follow, as you'll see from our example!
Remember though, that there are many ways to estimate a company's value, and a DCF is just one method. For those who are keen learners of equity analysis, the Simply Wall St analysis model here may be something of interest to you.
View our latest analysis for Korea Fuel-Tech
What's The Estimated Valuation?
We use what is known as a 2-stage model, which simply means we have two different periods of growth rates for the company's cash flows. Generally the first stage is higher growth, and the second stage is a lower growth phase. To start off with, we need to estimate the next ten years of cash flows. Where possible we use analyst estimates, but when these aren't available we extrapolate the previous free cash flow (FCF) from the last estimate or reported value. We assume companies with shrinking free cash flow will slow their rate of shrinkage, and that companies with growing free cash flow will see their growth rate slow, over this period. We do this to reflect that growth tends to slow more in the early years than it does in later years.
A DCF is all about the idea that a dollar in the future is less valuable than a dollar today, and so the sum of these future cash flows is then discounted to today's value:
10-year free cash flow (FCF) forecast
| 2024 | 2025 | 2026 | 2027 | 2028 | 2029 | 2030 | 2031 | 2032 | 2033 | |
| Levered FCF (₩, Millions) | ₩19.0b | ₩17.0b | ₩15.9b | ₩15.2b | ₩14.9b | ₩14.8b | ₩14.9b | ₩15.0b | ₩15.2b | ₩15.4b |
| Growth Rate Estimate Source | Analyst x1 | Est @ -10.57% | Est @ -6.67% | Est @ -3.95% | Est @ -2.04% | Est @ -0.71% | Est @ 0.23% | Est @ 0.88% | Est @ 1.34% | Est @ 1.66% |
| Present Value (₩, Millions) Discounted @ 11% | ₩17.1k | ₩13.8k | ₩11.6k | ₩10.0k | ₩8.8k | ₩7.9k | ₩7.1k | ₩6.5k | ₩5.9k | ₩5.4k |
("Est" = FCF growth rate estimated by Simply Wall St)
Present Value of 10-year Cash Flow (PVCF) = ₩94b
We now need to calculate the Terminal Value, which accounts for all the future cash flows after this ten year period. For a number of reasons a very conservative growth rate is used that cannot exceed that of a country's GDP growth. In this case we have used the 5-year average of the 10-year government bond yield (2.4%) to estimate future growth. In the same way as with the 10-year 'growth' period, we discount future cash flows to today's value, using a cost of equity of 11%.
Terminal Value (TV)= FCF2033 × (1 + g) ÷ (r – g) = ₩15b× (1 + 2.4%) ÷ (11%– 2.4%) = ₩183b
Present Value of Terminal Value (PVTV)= TV / (1 + r)10= ₩183b÷ ( 1 + 11%)10= ₩64b
The total value, or equity value, is then the sum of the present value of the future cash flows, which in this case is ₩158b. To get the intrinsic value per share, we divide this by the total number of shares outstanding. Compared to the current share price of ₩5.8k, the company appears around fair value at the time of writing. Valuations are imprecise instruments though, rather like a telescope - move a few degrees and end up in a different galaxy. Do keep this in mind.
The Assumptions
Now the most important inputs to a discounted cash flow are the discount rate, and of course, the actual cash flows. Part of investing is coming up with your own evaluation of a company's future performance, so try the calculation yourself and check your own assumptions. The DCF also does not consider the possible cyclicality of an industry, or a company's future capital requirements, so it does not give a full picture of a company's potential performance. Given that we are looking at Korea Fuel-Tech as potential shareholders, the cost of equity is used as the discount rate, rather than the cost of capital (or weighted average cost of capital, WACC) which accounts for debt. In this calculation we've used 11%, which is based on a levered beta of 1.625. Beta is a measure of a stock's volatility, compared to the market as a whole. We get our beta from the industry average beta of globally comparable companies, with an imposed limit between 0.8 and 2.0, which is a reasonable range for a stable business.
SWOT Analysis for Korea Fuel-Tech
Strength
- Earnings growth over the past year exceeded the industry.
- Debt is well covered by earnings and cashflows.
- Dividends are covered by earnings and cash flows.
Weakness
- Dividend is low compared to the top 25% of dividend payers in the Auto Components market.
- Expensive based on P/E ratio and estimated fair value.
Opportunity
- Annual revenue is forecast to grow faster than the South Korean market.
Threat
- No apparent threats visible for A123410.
Looking Ahead:
Although the valuation of a company is important, it is only one of many factors that you need to assess for a company. The DCF model is not a perfect stock valuation tool. Preferably you'd apply different cases and assumptions and see how they would impact the company's valuation. For example, changes in the company's cost of equity or the risk free rate can significantly impact the valuation. For Korea Fuel-Tech, we've compiled three additional elements you should consider:
- Risks: Consider for instance, the ever-present spectre of investment risk. We've identified 3 warning signs with Korea Fuel-Tech , and understanding them should be part of your investment process.
- Future Earnings: How does A123410's growth rate compare to its peers and the wider market? Dig deeper into the analyst consensus number for the upcoming years by interacting with our free analyst growth expectation chart.
- Other High Quality Alternatives: Do you like a good all-rounder? Explore our interactive list of high quality stocks to get an idea of what else is out there you may be missing!
PS. The Simply Wall St app conducts a discounted cash flow valuation for every stock on the KOSDAQ every day. If you want to find the calculation for other stocks just search here.
Valuation is complex, but we're here to simplify it.
Discover if Korea Fuel-Tech might be undervalued or overvalued with our detailed analysis, featuring fair value estimates, potential risks, dividends, insider trades, and its financial condition.
Access Free AnalysisHave feedback on this article? Concerned about the content? Get in touch with us directly. Alternatively, email editorial-team (at) simplywallst.com.
This article by Simply Wall St is general in nature. We provide commentary based on historical data and analyst forecasts only using an unbiased methodology and our articles are not intended to be financial advice. It does not constitute a recommendation to buy or sell any stock, and does not take account of your objectives, or your financial situation. We aim to bring you long-term focused analysis driven by fundamental data. Note that our analysis may not factor in the latest price-sensitive company announcements or qualitative material. Simply Wall St has no position in any stocks mentioned.
About KOSDAQ:A123410
Korea Fuel-Tech
Manufactures and sells automotive fuel systems and components in South Korea and internationally.
Flawless balance sheet with proven track record.
Market Insights

Advertisement
Community Narratives
Pole position to benefit from GENIUS Act
Fair Value US$233.04|59.7% undervalued
CH
Community Contributor
IREN will transform from bitcoin miner to leader in AI infrastructure
Fair Value US$21.48|13.5% undervalued
KA
Community Contributor
Behind the Assay: XRF Scientific’s Role in Modern Mining Economics
Fair Value AU$2.10|1.4% undervalued
RO
Community Contributor