Calculating The Fair Value Of Japan Airlines Co., Ltd. (TSE:9201)


Key Insights
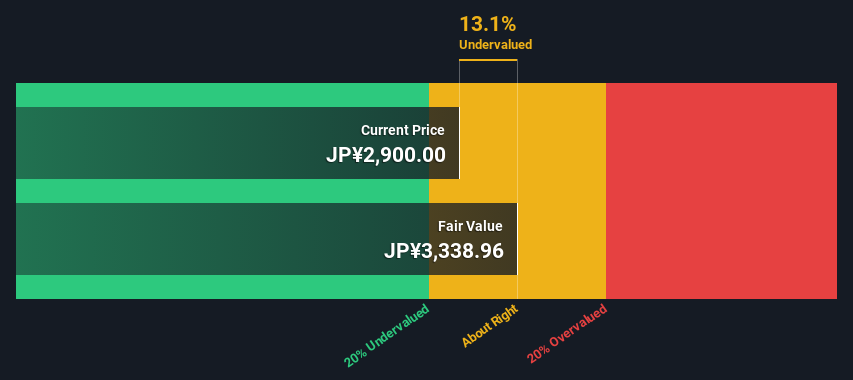
- The projected fair value for Japan Airlines is JP¥3,339 based on 2 Stage Free Cash Flow to Equity
- With JP¥2,900 share price, Japan Airlines appears to be trading close to its estimated fair value
- Our fair value estimate is similar to Japan Airlines' analyst price target of JP¥3,307
Does the April share price for Japan Airlines Co., Ltd. (TSE:9201) reflect what it's really worth? Today, we will estimate the stock's intrinsic value by estimating the company's future cash flows and discounting them to their present value. One way to achieve this is by employing the Discounted Cash Flow (DCF) model. It may sound complicated, but actually it is quite simple!
We generally believe that a company's value is the present value of all of the cash it will generate in the future. However, a DCF is just one valuation metric among many, and it is not without flaws. If you still have some burning questions about this type of valuation, take a look at the Simply Wall St analysis model.
View our latest analysis for Japan Airlines
Step By Step Through The Calculation
We are going to use a two-stage DCF model, which, as the name states, takes into account two stages of growth. The first stage is generally a higher growth period which levels off heading towards the terminal value, captured in the second 'steady growth' period. In the first stage we need to estimate the cash flows to the business over the next ten years. Where possible we use analyst estimates, but when these aren't available we extrapolate the previous free cash flow (FCF) from the last estimate or reported value. We assume companies with shrinking free cash flow will slow their rate of shrinkage, and that companies with growing free cash flow will see their growth rate slow, over this period. We do this to reflect that growth tends to slow more in the early years than it does in later years.
Generally we assume that a dollar today is more valuable than a dollar in the future, and so the sum of these future cash flows is then discounted to today's value:
10-year free cash flow (FCF) forecast
| 2024 | 2025 | 2026 | 2027 | 2028 | 2029 | 2030 | 2031 | 2032 | 2033 | |
| Levered FCF (¥, Millions) | JP¥77.7b | JP¥105.0b | JP¥126.6b | JP¥115.5b | JP¥108.5b | JP¥104.0b | JP¥100.9b | JP¥98.9b | JP¥97.6b | JP¥96.8b |
| Growth Rate Estimate Source | Analyst x3 | Analyst x4 | Analyst x4 | Est @ -8.75% | Est @ -6.08% | Est @ -4.21% | Est @ -2.90% | Est @ -1.98% | Est @ -1.34% | Est @ -0.89% |
| Present Value (¥, Millions) Discounted @ 6.9% | JP¥72.7k | JP¥91.8k | JP¥103.6k | JP¥88.4k | JP¥77.6k | JP¥69.5k | JP¥63.1k | JP¥57.9k | JP¥53.4k | JP¥49.5k |
("Est" = FCF growth rate estimated by Simply Wall St)
Present Value of 10-year Cash Flow (PVCF) = JP¥727b
The second stage is also known as Terminal Value, this is the business's cash flow after the first stage. The Gordon Growth formula is used to calculate Terminal Value at a future annual growth rate equal to the 5-year average of the 10-year government bond yield of 0.2%. We discount the terminal cash flows to today's value at a cost of equity of 6.9%.
Terminal Value (TV)= FCF2033 × (1 + g) ÷ (r – g) = JP¥97b× (1 + 0.2%) ÷ (6.9%– 0.2%) = JP¥1.4t
Present Value of Terminal Value (PVTV)= TV / (1 + r)10= JP¥1.4t÷ ( 1 + 6.9%)10= JP¥732b
The total value, or equity value, is then the sum of the present value of the future cash flows, which in this case is JP¥1.5t. To get the intrinsic value per share, we divide this by the total number of shares outstanding. Compared to the current share price of JP¥2.9k, the company appears about fair value at a 13% discount to where the stock price trades currently. The assumptions in any calculation have a big impact on the valuation, so it is better to view this as a rough estimate, not precise down to the last cent.
Important Assumptions
Now the most important inputs to a discounted cash flow are the discount rate, and of course, the actual cash flows. You don't have to agree with these inputs, I recommend redoing the calculations yourself and playing with them. The DCF also does not consider the possible cyclicality of an industry, or a company's future capital requirements, so it does not give a full picture of a company's potential performance. Given that we are looking at Japan Airlines as potential shareholders, the cost of equity is used as the discount rate, rather than the cost of capital (or weighted average cost of capital, WACC) which accounts for debt. In this calculation we've used 6.9%, which is based on a levered beta of 1.203. Beta is a measure of a stock's volatility, compared to the market as a whole. We get our beta from the industry average beta of globally comparable companies, with an imposed limit between 0.8 and 2.0, which is a reasonable range for a stable business.
SWOT Analysis for Japan Airlines
- Debt is not viewed as a risk.
- Dividends are covered by earnings and cash flows.
- Dividend is low compared to the top 25% of dividend payers in the Airlines market.
- Annual revenue is forecast to grow faster than the Japanese market.
- Good value based on P/E ratio and estimated fair value.
- Annual earnings are forecast to grow slower than the Japanese market.
Looking Ahead:
Although the valuation of a company is important, it shouldn't be the only metric you look at when researching a company. It's not possible to obtain a foolproof valuation with a DCF model. Rather it should be seen as a guide to "what assumptions need to be true for this stock to be under/overvalued?" If a company grows at a different rate, or if its cost of equity or risk free rate changes sharply, the output can look very different. For Japan Airlines, there are three fundamental factors you should consider:
- Risks: Case in point, we've spotted 1 warning sign for Japan Airlines you should be aware of.
- Future Earnings: How does 9201's growth rate compare to its peers and the wider market? Dig deeper into the analyst consensus number for the upcoming years by interacting with our free analyst growth expectation chart.
- Other Solid Businesses: Low debt, high returns on equity and good past performance are fundamental to a strong business. Why not explore our interactive list of stocks with solid business fundamentals to see if there are other companies you may not have considered!
PS. The Simply Wall St app conducts a discounted cash flow valuation for every stock on the TSE every day. If you want to find the calculation for other stocks just search here.
New: Manage All Your Stock Portfolios in One Place
We've created the ultimate portfolio companion for stock investors, and it's free.
• Connect an unlimited number of Portfolios and see your total in one currency
• Be alerted to new Warning Signs or Risks via email or mobile
• Track the Fair Value of your stocks
Have feedback on this article? Concerned about the content? Get in touch with us directly. Alternatively, email editorial-team (at) simplywallst.com.
This article by Simply Wall St is general in nature. We provide commentary based on historical data and analyst forecasts only using an unbiased methodology and our articles are not intended to be financial advice. It does not constitute a recommendation to buy or sell any stock, and does not take account of your objectives, or your financial situation. We aim to bring you long-term focused analysis driven by fundamental data. Note that our analysis may not factor in the latest price-sensitive company announcements or qualitative material. Simply Wall St has no position in any stocks mentioned.
About TSE:9201
Japan Airlines
Provides scheduled and non-scheduled air transport services in Japan, Asia, Oceania, North America, the Unietd Kingdom, and Europe.
Excellent balance sheet second-rate dividend payer.

