- Japan
- /
- Transportation
- /
- TSE:9063
Okayamaken Freight Transportation (TSE:9063) Seems To Be Using A Lot Of Debt


The external fund manager backed by Berkshire Hathaway's Charlie Munger, Li Lu, makes no bones about it when he says 'The biggest investment risk is not the volatility of prices, but whether you will suffer a permanent loss of capital.' So it seems the smart money knows that debt - which is usually involved in bankruptcies - is a very important factor, when you assess how risky a company is. We note that Okayamaken Freight Transportation Co., Ltd. (TSE:9063) does have debt on its balance sheet. But the more important question is: how much risk is that debt creating?
What Risk Does Debt Bring?
Debt is a tool to help businesses grow, but if a business is incapable of paying off its lenders, then it exists at their mercy. Part and parcel of capitalism is the process of 'creative destruction' where failed businesses are mercilessly liquidated by their bankers. However, a more usual (but still expensive) situation is where a company must dilute shareholders at a cheap share price simply to get debt under control. Of course, the upside of debt is that it often represents cheap capital, especially when it replaces dilution in a company with the ability to reinvest at high rates of return. The first step when considering a company's debt levels is to consider its cash and debt together.
Check out our latest analysis for Okayamaken Freight Transportation
What Is Okayamaken Freight Transportation's Debt?
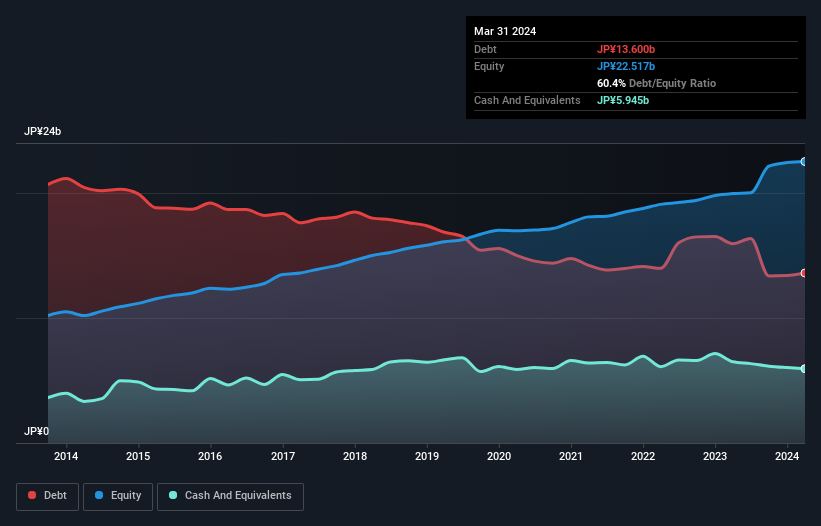
You can click the graphic below for the historical numbers, but it shows that Okayamaken Freight Transportation had JP¥13.6b of debt in March 2024, down from JP¥15.9b, one year before. On the flip side, it has JP¥5.95b in cash leading to net debt of about JP¥7.66b.
A Look At Okayamaken Freight Transportation's Liabilities
According to the last reported balance sheet, Okayamaken Freight Transportation had liabilities of JP¥10.7b due within 12 months, and liabilities of JP¥13.2b due beyond 12 months. Offsetting this, it had JP¥5.95b in cash and JP¥6.09b in receivables that were due within 12 months. So it has liabilities totalling JP¥11.9b more than its cash and near-term receivables, combined.
This deficit casts a shadow over the JP¥6.48b company, like a colossus towering over mere mortals. So we'd watch its balance sheet closely, without a doubt. After all, Okayamaken Freight Transportation would likely require a major re-capitalisation if it had to pay its creditors today.
We use two main ratios to inform us about debt levels relative to earnings. The first is net debt divided by earnings before interest, tax, depreciation, and amortization (EBITDA), while the second is how many times its earnings before interest and tax (EBIT) covers its interest expense (or its interest cover, for short). The advantage of this approach is that we take into account both the absolute quantum of debt (with net debt to EBITDA) and the actual interest expenses associated with that debt (with its interest cover ratio).
Okayamaken Freight Transportation has a debt to EBITDA ratio of 3.3 and its EBIT covered its interest expense 6.5 times. Taken together this implies that, while we wouldn't want to see debt levels rise, we think it can handle its current leverage. Importantly, Okayamaken Freight Transportation's EBIT fell a jaw-dropping 43% in the last twelve months. If that decline continues then paying off debt will be harder than selling foie gras at a vegan convention. When analysing debt levels, the balance sheet is the obvious place to start. But it is Okayamaken Freight Transportation's earnings that will influence how the balance sheet holds up in the future. So if you're keen to discover more about its earnings, it might be worth checking out this graph of its long term earnings trend.
Finally, while the tax-man may adore accounting profits, lenders only accept cold hard cash. So it's worth checking how much of that EBIT is backed by free cash flow. Over the last three years, Okayamaken Freight Transportation saw substantial negative free cash flow, in total. While that may be a result of expenditure for growth, it does make the debt far more risky.
Our View
On the face of it, Okayamaken Freight Transportation's EBIT growth rate left us tentative about the stock, and its level of total liabilities was no more enticing than the one empty restaurant on the busiest night of the year. But on the bright side, its interest cover is a good sign, and makes us more optimistic. We think the chances that Okayamaken Freight Transportation has too much debt a very significant. To our minds, that means the stock is rather high risk, and probably one to avoid; but to each their own (investing) style. When analysing debt levels, the balance sheet is the obvious place to start. But ultimately, every company can contain risks that exist outside of the balance sheet. Case in point: We've spotted 3 warning signs for Okayamaken Freight Transportation you should be aware of.
If, after all that, you're more interested in a fast growing company with a rock-solid balance sheet, then check out our list of net cash growth stocks without delay.
If you're looking to trade Okayamaken Freight Transportation, open an account with the lowest-cost platform trusted by professionals, Interactive Brokers.
With clients in over 200 countries and territories, and access to 160 markets, IBKR lets you trade stocks, options, futures, forex, bonds and funds from a single integrated account.
Enjoy no hidden fees, no account minimums, and FX conversion rates as low as 0.03%, far better than what most brokers offer.
Sponsored ContentNew: AI Stock Screener & Alerts
Our new AI Stock Screener scans the market every day to uncover opportunities.
• Dividend Powerhouses (3%+ Yield)
• Undervalued Small Caps with Insider Buying
• High growth Tech and AI Companies
Or build your own from over 50 metrics.
Have feedback on this article? Concerned about the content? Get in touch with us directly. Alternatively, email editorial-team (at) simplywallst.com.
This article by Simply Wall St is general in nature. We provide commentary based on historical data and analyst forecasts only using an unbiased methodology and our articles are not intended to be financial advice. It does not constitute a recommendation to buy or sell any stock, and does not take account of your objectives, or your financial situation. We aim to bring you long-term focused analysis driven by fundamental data. Note that our analysis may not factor in the latest price-sensitive company announcements or qualitative material. Simply Wall St has no position in any stocks mentioned.
Have feedback on this article? Concerned about the content? Get in touch with us directly. Alternatively, email editorial-team@simplywallst.com
About TSE:9063
Okayamaken Freight Transportation
Okayamaken Freight Transportation Co., Ltd.
Excellent balance sheet established dividend payer.
Market Insights

Community Narratives


