- Japan
- /
- Telecom Services and Carriers
- /
- TSE:9432
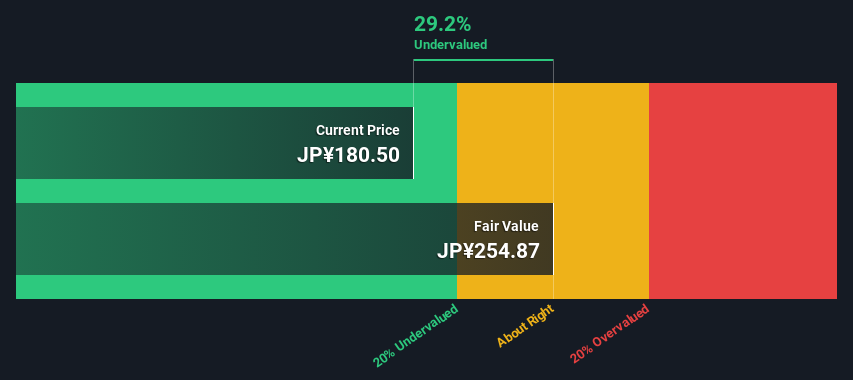
Are Investors Undervaluing Nippon Telegraph and Telephone Corporation (TSE:9432) By 29%?


Key Insights
- Using the 2 Stage Free Cash Flow to Equity, Nippon Telegraph and Telephone fair value estimate is JP¥255
- Current share price of JP¥181 suggests Nippon Telegraph and Telephone is potentially 29% undervalued
- Analyst price target for 9432 is JP¥200 which is 22% below our fair value estimate
Today we'll do a simple run through of a valuation method used to estimate the attractiveness of Nippon Telegraph and Telephone Corporation (TSE:9432) as an investment opportunity by taking the forecast future cash flows of the company and discounting them back to today's value. We will take advantage of the Discounted Cash Flow (DCF) model for this purpose. Before you think you won't be able to understand it, just read on! It's actually much less complex than you'd imagine.
Remember though, that there are many ways to estimate a company's value, and a DCF is just one method. If you still have some burning questions about this type of valuation, take a look at the Simply Wall St analysis model.
View our latest analysis for Nippon Telegraph and Telephone
Crunching The Numbers
We're using the 2-stage growth model, which simply means we take in account two stages of company's growth. In the initial period the company may have a higher growth rate and the second stage is usually assumed to have a stable growth rate. In the first stage we need to estimate the cash flows to the business over the next ten years. Where possible we use analyst estimates, but when these aren't available we extrapolate the previous free cash flow (FCF) from the last estimate or reported value. We assume companies with shrinking free cash flow will slow their rate of shrinkage, and that companies with growing free cash flow will see their growth rate slow, over this period. We do this to reflect that growth tends to slow more in the early years than it does in later years.
Generally we assume that a dollar today is more valuable than a dollar in the future, and so the sum of these future cash flows is then discounted to today's value:
10-year free cash flow (FCF) estimate
| 2024 | 2025 | 2026 | 2027 | 2028 | 2029 | 2030 | 2031 | 2032 | 2033 | |
| Levered FCF (¥, Millions) | JP¥954.2b | JP¥854.5b | JP¥959.5b | JP¥906.9b | JP¥944.1b | JP¥960.1b | JP¥972.0b | JP¥980.9b | JP¥987.6b | JP¥992.8b |
| Growth Rate Estimate Source | Analyst x7 | Analyst x8 | Analyst x8 | Analyst x3 | Analyst x3 | Est @ 1.70% | Est @ 1.24% | Est @ 0.91% | Est @ 0.69% | Est @ 0.53% |
| Present Value (¥, Millions) Discounted @ 4.7% | JP¥911.7k | JP¥780.1k | JP¥836.9k | JP¥755.8k | JP¥751.7k | JP¥730.4k | JP¥706.4k | JP¥681.1k | JP¥655.3k | JP¥629.4k |
("Est" = FCF growth rate estimated by Simply Wall St)
Present Value of 10-year Cash Flow (PVCF) = JP¥7.4t
After calculating the present value of future cash flows in the initial 10-year period, we need to calculate the Terminal Value, which accounts for all future cash flows beyond the first stage. The Gordon Growth formula is used to calculate Terminal Value at a future annual growth rate equal to the 5-year average of the 10-year government bond yield of 0.2%. We discount the terminal cash flows to today's value at a cost of equity of 4.7%.
Terminal Value (TV)= FCF2033 × (1 + g) ÷ (r – g) = JP¥993b× (1 + 0.2%) ÷ (4.7%– 0.2%) = JP¥22t
Present Value of Terminal Value (PVTV)= TV / (1 + r)10= JP¥22t÷ ( 1 + 4.7%)10= JP¥14t
The total value, or equity value, is then the sum of the present value of the future cash flows, which in this case is JP¥21t. To get the intrinsic value per share, we divide this by the total number of shares outstanding. Compared to the current share price of JP¥181, the company appears a touch undervalued at a 29% discount to where the stock price trades currently. The assumptions in any calculation have a big impact on the valuation, so it is better to view this as a rough estimate, not precise down to the last cent.
Important Assumptions
Now the most important inputs to a discounted cash flow are the discount rate, and of course, the actual cash flows. Part of investing is coming up with your own evaluation of a company's future performance, so try the calculation yourself and check your own assumptions. The DCF also does not consider the possible cyclicality of an industry, or a company's future capital requirements, so it does not give a full picture of a company's potential performance. Given that we are looking at Nippon Telegraph and Telephone as potential shareholders, the cost of equity is used as the discount rate, rather than the cost of capital (or weighted average cost of capital, WACC) which accounts for debt. In this calculation we've used 4.7%, which is based on a levered beta of 0.800. Beta is a measure of a stock's volatility, compared to the market as a whole. We get our beta from the industry average beta of globally comparable companies, with an imposed limit between 0.8 and 2.0, which is a reasonable range for a stable business.
SWOT Analysis for Nippon Telegraph and Telephone
- Debt is well covered by earnings and cashflows.
- Dividends are covered by earnings and cash flows.
- Earnings growth over the past year underperformed the Telecom industry.
- Dividend is low compared to the top 25% of dividend payers in the Telecom market.
- Annual earnings are forecast to grow for the next 3 years.
- Good value based on P/E ratio and estimated fair value.
- Annual earnings are forecast to grow slower than the Japanese market.
Next Steps:
Valuation is only one side of the coin in terms of building your investment thesis, and it ideally won't be the sole piece of analysis you scrutinize for a company. DCF models are not the be-all and end-all of investment valuation. Rather it should be seen as a guide to "what assumptions need to be true for this stock to be under/overvalued?" For example, changes in the company's cost of equity or the risk free rate can significantly impact the valuation. Can we work out why the company is trading at a discount to intrinsic value? For Nippon Telegraph and Telephone, we've compiled three further elements you should consider:
- Risks: Take risks, for example - Nippon Telegraph and Telephone has 1 warning sign we think you should be aware of.
- Future Earnings: How does 9432's growth rate compare to its peers and the wider market? Dig deeper into the analyst consensus number for the upcoming years by interacting with our free analyst growth expectation chart.
- Other Solid Businesses: Low debt, high returns on equity and good past performance are fundamental to a strong business. Why not explore our interactive list of stocks with solid business fundamentals to see if there are other companies you may not have considered!
PS. The Simply Wall St app conducts a discounted cash flow valuation for every stock on the TSE every day. If you want to find the calculation for other stocks just search here.
Valuation is complex, but we're here to simplify it.
Discover if Nippon Telegraph and Telephone might be undervalued or overvalued with our detailed analysis, featuring fair value estimates, potential risks, dividends, insider trades, and its financial condition.
Access Free AnalysisHave feedback on this article? Concerned about the content? Get in touch with us directly. Alternatively, email editorial-team (at) simplywallst.com.
This article by Simply Wall St is general in nature. We provide commentary based on historical data and analyst forecasts only using an unbiased methodology and our articles are not intended to be financial advice. It does not constitute a recommendation to buy or sell any stock, and does not take account of your objectives, or your financial situation. We aim to bring you long-term focused analysis driven by fundamental data. Note that our analysis may not factor in the latest price-sensitive company announcements or qualitative material. Simply Wall St has no position in any stocks mentioned.
About TSE:9432
Nippon Telegraph and Telephone
Operates as a telecommunications company in Japan and internationally.
Undervalued established dividend payer.
Similar Companies
Market Insights

Community Narratives

