
Advertisement
- Japan
- /
- Telecom Services and Carriers
- /
- TSE:4415
Why Broad Enterprise Co.,Ltd. (TSE:4415) Looks Like A Quality Company
One of the best investments we can make is in our own knowledge and skill set. With that in mind, this article will work through how we can use Return On Equity (ROE) to better understand a business. We'll use ROE to examine Broad Enterprise Co.,Ltd. (TSE:4415), by way of a worked example.
Return on Equity or ROE is a test of how effectively a company is growing its value and managing investors’ money. Put another way, it reveals the company's success at turning shareholder investments into profits.
How To Calculate Return On Equity?
Return on equity can be calculated by using the formula:
Return on Equity = Net Profit (from continuing operations) ÷ Shareholders' Equity
So, based on the above formula, the ROE for Broad EnterpriseLtd is:
31% = JP¥462m ÷ JP¥1.5b (Based on the trailing twelve months to June 2025).
The 'return' is the profit over the last twelve months. So, this means that for every ¥1 of its shareholder's investments, the company generates a profit of ¥0.31.
Check out our latest analysis for Broad EnterpriseLtd
Does Broad EnterpriseLtd Have A Good ROE?
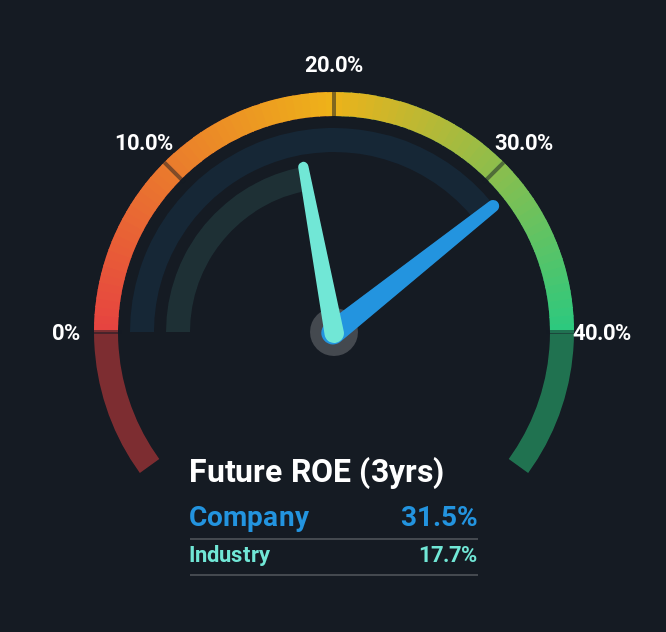
One simple way to determine if a company has a good return on equity is to compare it to the average for its industry. However, this method is only useful as a rough check, because companies do differ quite a bit within the same industry classification. Pleasingly, Broad EnterpriseLtd has a superior ROE than the average (18%) in the Telecom industry.
That is a good sign. With that said, a high ROE doesn't always indicate high profitability. Aside from changes in net income, a high ROE can also be the outcome of high debt relative to equity, which indicates risk. You can see the 4 risks we have identified for Broad EnterpriseLtd by visiting our risks dashboard for free on our platform here.
How Does Debt Impact ROE?
Companies usually need to invest money to grow their profits. That cash can come from retained earnings, issuing new shares (equity), or debt. In the first and second cases, the ROE will reflect this use of cash for investment in the business. In the latter case, the debt used for growth will improve returns, but won't affect the total equity. In this manner the use of debt will boost ROE, even though the core economics of the business stay the same.
Broad EnterpriseLtd's Debt And Its 31% ROE
It seems that Broad EnterpriseLtd uses a huge volume of debt to fund the business, since it has an extremely high debt to equity ratio of 3.50. Its ROE is clearly quite good, but it seems to be boosted by the significant use of debt by the company.
Conclusion
Return on equity is a useful indicator of the ability of a business to generate profits and return them to shareholders. Companies that can achieve high returns on equity without too much debt are generally of good quality. If two companies have around the same level of debt to equity, and one has a higher ROE, I'd generally prefer the one with higher ROE.
But when a business is high quality, the market often bids it up to a price that reflects this. The rate at which profits are likely to grow, relative to the expectations of profit growth reflected in the current price, must be considered, too. You can see how the company has grow in the past by looking at this FREE detailed graph of past earnings, revenue and cash flow.
But note: Broad EnterpriseLtd may not be the best stock to buy. So take a peek at this free list of interesting companies with high ROE and low debt.
Valuation is complex, but we're here to simplify it.
Discover if Broad EnterpriseLtd might be undervalued or overvalued with our detailed analysis, featuring fair value estimates, potential risks, dividends, insider trades, and its financial condition.
Access Free AnalysisHave feedback on this article? Concerned about the content? Get in touch with us directly. Alternatively, email editorial-team (at) simplywallst.com.
This article by Simply Wall St is general in nature. We provide commentary based on historical data and analyst forecasts only using an unbiased methodology and our articles are not intended to be financial advice. It does not constitute a recommendation to buy or sell any stock, and does not take account of your objectives, or your financial situation. We aim to bring you long-term focused analysis driven by fundamental data. Note that our analysis may not factor in the latest price-sensitive company announcements or qualitative material. Simply Wall St has no position in any stocks mentioned.
About TSE:4415
Broad EnterpriseLtd
Provides Internet infrastructure for condominium management in Japan.
Proven track record with slight risk.
Market Insights


Advertisement
Community Narratives
100% Patient Improvement in trial puts this $16M Biotech on the radar
Fair Value US$5.30|72.3% undervalued
JO
Community Contributor
PayPal's Future Growth Through Venmo and Merchant Solutions
Fair Value US$105.25|35.0% undervalued
ZW
Community Contributor
IREN's Bold Moves in Sustainable Bitcoin Mining & AI Data Centers
Fair Value US$26.54|1.3% undervalued
BL
Community Contributor