- Japan
- /
- Electronic Equipment and Components
- /
- TSE:8060
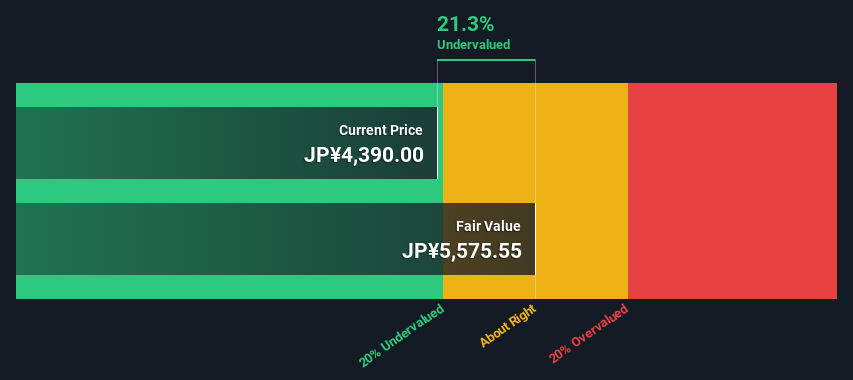
Is There An Opportunity With Canon Marketing Japan Inc.'s (TSE:8060) 21% Undervaluation?


Key Insights
- Canon Marketing Japan's estimated fair value is JP¥5,576 based on 2 Stage Free Cash Flow to Equity
- Current share price of JP¥4,390 suggests Canon Marketing Japan is potentially 21% undervalued
- The average premium for Canon Marketing Japan's competitorsis currently 83%
Does the May share price for Canon Marketing Japan Inc. (TSE:8060) reflect what it's really worth? Today, we will estimate the stock's intrinsic value by projecting its future cash flows and then discounting them to today's value. Our analysis will employ the Discounted Cash Flow (DCF) model. Don't get put off by the jargon, the math behind it is actually quite straightforward.
We would caution that there are many ways of valuing a company and, like the DCF, each technique has advantages and disadvantages in certain scenarios. Anyone interested in learning a bit more about intrinsic value should have a read of the Simply Wall St analysis model.
Check out our latest analysis for Canon Marketing Japan
The Model
We're using the 2-stage growth model, which simply means we take in account two stages of company's growth. In the initial period the company may have a higher growth rate and the second stage is usually assumed to have a stable growth rate. In the first stage we need to estimate the cash flows to the business over the next ten years. Where possible we use analyst estimates, but when these aren't available we extrapolate the previous free cash flow (FCF) from the last estimate or reported value. We assume companies with shrinking free cash flow will slow their rate of shrinkage, and that companies with growing free cash flow will see their growth rate slow, over this period. We do this to reflect that growth tends to slow more in the early years than it does in later years.
Generally we assume that a dollar today is more valuable than a dollar in the future, so we discount the value of these future cash flows to their estimated value in today's dollars:
10-year free cash flow (FCF) forecast
| 2024 | 2025 | 2026 | 2027 | 2028 | 2029 | 2030 | 2031 | 2032 | 2033 | |
| Levered FCF (¥, Millions) | JP¥28.4b | JP¥37.8b | JP¥38.9b | JP¥41.3b | JP¥43.8b | JP¥45.4b | JP¥46.6b | JP¥47.4b | JP¥48.1b | JP¥48.6b |
| Growth Rate Estimate Source | Analyst x1 | Analyst x2 | Analyst x1 | Analyst x1 | Analyst x1 | Est @ 3.62% | Est @ 2.59% | Est @ 1.87% | Est @ 1.37% | Est @ 1.02% |
| Present Value (¥, Millions) Discounted @ 6.4% | JP¥26.7k | JP¥33.3k | JP¥32.3k | JP¥32.2k | JP¥32.1k | JP¥31.3k | JP¥30.2k | JP¥28.9k | JP¥27.5k | JP¥26.1k |
("Est" = FCF growth rate estimated by Simply Wall St)
Present Value of 10-year Cash Flow (PVCF) = JP¥301b
The second stage is also known as Terminal Value, this is the business's cash flow after the first stage. For a number of reasons a very conservative growth rate is used that cannot exceed that of a country's GDP growth. In this case we have used the 5-year average of the 10-year government bond yield (0.2%) to estimate future growth. In the same way as with the 10-year 'growth' period, we discount future cash flows to today's value, using a cost of equity of 6.4%.
Terminal Value (TV)= FCF2033 × (1 + g) ÷ (r – g) = JP¥49b× (1 + 0.2%) ÷ (6.4%– 0.2%) = JP¥785b
Present Value of Terminal Value (PVTV)= TV / (1 + r)10= JP¥785b÷ ( 1 + 6.4%)10= JP¥422b
The total value, or equity value, is then the sum of the present value of the future cash flows, which in this case is JP¥723b. To get the intrinsic value per share, we divide this by the total number of shares outstanding. Relative to the current share price of JP¥4.4k, the company appears a touch undervalued at a 21% discount to where the stock price trades currently. Remember though, that this is just an approximate valuation, and like any complex formula - garbage in, garbage out.
Important Assumptions
The calculation above is very dependent on two assumptions. The first is the discount rate and the other is the cash flows. You don't have to agree with these inputs, I recommend redoing the calculations yourself and playing with them. The DCF also does not consider the possible cyclicality of an industry, or a company's future capital requirements, so it does not give a full picture of a company's potential performance. Given that we are looking at Canon Marketing Japan as potential shareholders, the cost of equity is used as the discount rate, rather than the cost of capital (or weighted average cost of capital, WACC) which accounts for debt. In this calculation we've used 6.4%, which is based on a levered beta of 1.101. Beta is a measure of a stock's volatility, compared to the market as a whole. We get our beta from the industry average beta of globally comparable companies, with an imposed limit between 0.8 and 2.0, which is a reasonable range for a stable business.
SWOT Analysis for Canon Marketing Japan
- Debt is not viewed as a risk.
- Earnings declined over the past year.
- Dividend is low compared to the top 25% of dividend payers in the Electronic market.
- Annual earnings are forecast to grow for the next 3 years.
- Trading below our estimate of fair value by more than 20%.
- Dividends are not covered by cash flow.
Next Steps:
Whilst important, the DCF calculation ideally won't be the sole piece of analysis you scrutinize for a company. It's not possible to obtain a foolproof valuation with a DCF model. Instead the best use for a DCF model is to test certain assumptions and theories to see if they would lead to the company being undervalued or overvalued. For example, changes in the company's cost of equity or the risk free rate can significantly impact the valuation. Why is the intrinsic value higher than the current share price? For Canon Marketing Japan, there are three additional items you should further examine:
- Risks: As an example, we've found 1 warning sign for Canon Marketing Japan that you need to consider before investing here.
- Future Earnings: How does 8060's growth rate compare to its peers and the wider market? Dig deeper into the analyst consensus number for the upcoming years by interacting with our free analyst growth expectation chart.
- Other Solid Businesses: Low debt, high returns on equity and good past performance are fundamental to a strong business. Why not explore our interactive list of stocks with solid business fundamentals to see if there are other companies you may not have considered!
PS. The Simply Wall St app conducts a discounted cash flow valuation for every stock on the TSE every day. If you want to find the calculation for other stocks just search here.
If you're looking to trade Canon Marketing Japan, open an account with the lowest-cost platform trusted by professionals, Interactive Brokers.
With clients in over 200 countries and territories, and access to 160 markets, IBKR lets you trade stocks, options, futures, forex, bonds and funds from a single integrated account.
Enjoy no hidden fees, no account minimums, and FX conversion rates as low as 0.03%, far better than what most brokers offer.
Sponsored ContentNew: AI Stock Screener & Alerts
Our new AI Stock Screener scans the market every day to uncover opportunities.
• Dividend Powerhouses (3%+ Yield)
• Undervalued Small Caps with Insider Buying
• High growth Tech and AI Companies
Or build your own from over 50 metrics.
Have feedback on this article? Concerned about the content? Get in touch with us directly. Alternatively, email editorial-team (at) simplywallst.com.
This article by Simply Wall St is general in nature. We provide commentary based on historical data and analyst forecasts only using an unbiased methodology and our articles are not intended to be financial advice. It does not constitute a recommendation to buy or sell any stock, and does not take account of your objectives, or your financial situation. We aim to bring you long-term focused analysis driven by fundamental data. Note that our analysis may not factor in the latest price-sensitive company announcements or qualitative material. Simply Wall St has no position in any stocks mentioned.
About TSE:8060
Canon Marketing Japan
Canon Marketing Japan Inc. markets and sells Canon products and related solutions in Japan.
Excellent balance sheet with proven track record and pays a dividend.
Market Insights

Community Narratives


