
Advertisement
Some say volatility, rather than debt, is the best way to think about risk as an investor, but Warren Buffett famously said that 'Volatility is far from synonymous with risk.' It's only natural to consider a company's balance sheet when you examine how risky it is, since debt is often involved when a business collapses. As with many other companies Oi Electric Co., Ltd. (TSE:6822) makes use of debt. But should shareholders be worried about its use of debt?
Why Does Debt Bring Risk?
Debt and other liabilities become risky for a business when it cannot easily fulfill those obligations, either with free cash flow or by raising capital at an attractive price. Part and parcel of capitalism is the process of 'creative destruction' where failed businesses are mercilessly liquidated by their bankers. While that is not too common, we often do see indebted companies permanently diluting shareholders because lenders force them to raise capital at a distressed price. Having said that, the most common situation is where a company manages its debt reasonably well - and to its own advantage. The first step when considering a company's debt levels is to consider its cash and debt together.
What Is Oi Electric's Net Debt?
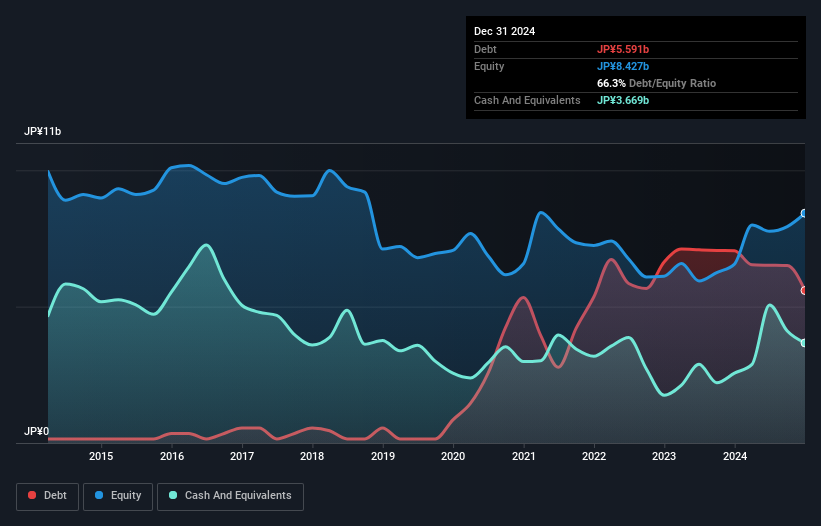
As you can see below, Oi Electric had JP¥5.59b of debt at December 2024, down from JP¥7.05b a year prior. However, it also had JP¥3.67b in cash, and so its net debt is JP¥1.92b.
A Look At Oi Electric's Liabilities
We can see from the most recent balance sheet that Oi Electric had liabilities of JP¥10.2b falling due within a year, and liabilities of JP¥2.92b due beyond that. Offsetting this, it had JP¥3.67b in cash and JP¥4.77b in receivables that were due within 12 months. So it has liabilities totalling JP¥4.70b more than its cash and near-term receivables, combined.
When you consider that this deficiency exceeds the company's JP¥3.60b market capitalization, you might well be inclined to review the balance sheet intently. Hypothetically, extremely heavy dilution would be required if the company were forced to pay down its liabilities by raising capital at the current share price.
View our latest analysis for Oi Electric
In order to size up a company's debt relative to its earnings, we calculate its net debt divided by its earnings before interest, tax, depreciation, and amortization (EBITDA) and its earnings before interest and tax (EBIT) divided by its interest expense (its interest cover). Thus we consider debt relative to earnings both with and without depreciation and amortization expenses.
Oi Electric's net debt is only 0.95 times its EBITDA. And its EBIT easily covers its interest expense, being 16.1 times the size. So you could argue it is no more threatened by its debt than an elephant is by a mouse. Even more impressive was the fact that Oi Electric grew its EBIT by 159% over twelve months. If maintained that growth will make the debt even more manageable in the years ahead. The balance sheet is clearly the area to focus on when you are analysing debt. But it is Oi Electric's earnings that will influence how the balance sheet holds up in the future. So if you're keen to discover more about its earnings, it might be worth checking out this graph of its long term earnings trend.
But our final consideration is also important, because a company cannot pay debt with paper profits; it needs cold hard cash. So the logical step is to look at the proportion of that EBIT that is matched by actual free cash flow. During the last two years, Oi Electric generated free cash flow amounting to a very robust 91% of its EBIT, more than we'd expect. That puts it in a very strong position to pay down debt.
Our View
The good news is that Oi Electric's demonstrated ability to cover its interest expense with its EBIT delights us like a fluffy puppy does a toddler. But we must concede we find its level of total liabilities has the opposite effect. Looking at all the aforementioned factors together, it strikes us that Oi Electric can handle its debt fairly comfortably. On the plus side, this leverage can boost shareholder returns, but the potential downside is more risk of loss, so it's worth monitoring the balance sheet. When analysing debt levels, the balance sheet is the obvious place to start. But ultimately, every company can contain risks that exist outside of the balance sheet. Be aware that Oi Electric is showing 2 warning signs in our investment analysis , you should know about...
Of course, if you're the type of investor who prefers buying stocks without the burden of debt, then don't hesitate to discover our exclusive list of net cash growth stocks, today.
New: AI Stock Screener & Alerts
Our new AI Stock Screener scans the market every day to uncover opportunities.
• Dividend Powerhouses (3%+ Yield)
• Undervalued Small Caps with Insider Buying
• High growth Tech and AI Companies
Or build your own from over 50 metrics.
Have feedback on this article? Concerned about the content? Get in touch with us directly. Alternatively, email editorial-team (at) simplywallst.com.
This article by Simply Wall St is general in nature. We provide commentary based on historical data and analyst forecasts only using an unbiased methodology and our articles are not intended to be financial advice. It does not constitute a recommendation to buy or sell any stock, and does not take account of your objectives, or your financial situation. We aim to bring you long-term focused analysis driven by fundamental data. Note that our analysis may not factor in the latest price-sensitive company announcements or qualitative material. Simply Wall St has no position in any stocks mentioned.
About TSE:6822
Oi Electric
Provides information and communication equipment and related services for social infrastructure in Japan.
Excellent balance sheet and good value.
Market Insights


Advertisement
Community Narratives
America Wants Homegrown Drones — Draganfly Is Ready to Deliver
Fair Value US$9.21|27.4% undervalued
JO
Community Contributor
Cheesecake Factory offers an enticing opportunity for long-term growth by leveraging new concepts
Fair Value US$73.83|25.8% undervalued
ZW
Community Contributor
Coca-Cola’s Intrinsic Value Set to Rise with Fed Rate Cut
Fair Value US$67.50|2.7% undervalued
AL
Community Contributor
Fully Permitted Gold Mine with 50 Baggers Potential 
Fair Value CA$41.00|98.0% undervalued
RO
Community Contributor