- Japan
- /
- Electronic Equipment and Components
- /
- TSE:6663
What Taiyo Technolex Co.,Ltd.'s (TSE:6663) 39% Share Price Gain Is Not Telling You

Taiyo Technolex Co.,Ltd. (TSE:6663) shares have had a really impressive month, gaining 39% after a shaky period beforehand. Notwithstanding the latest gain, the annual share price return of 6.1% isn't as impressive.
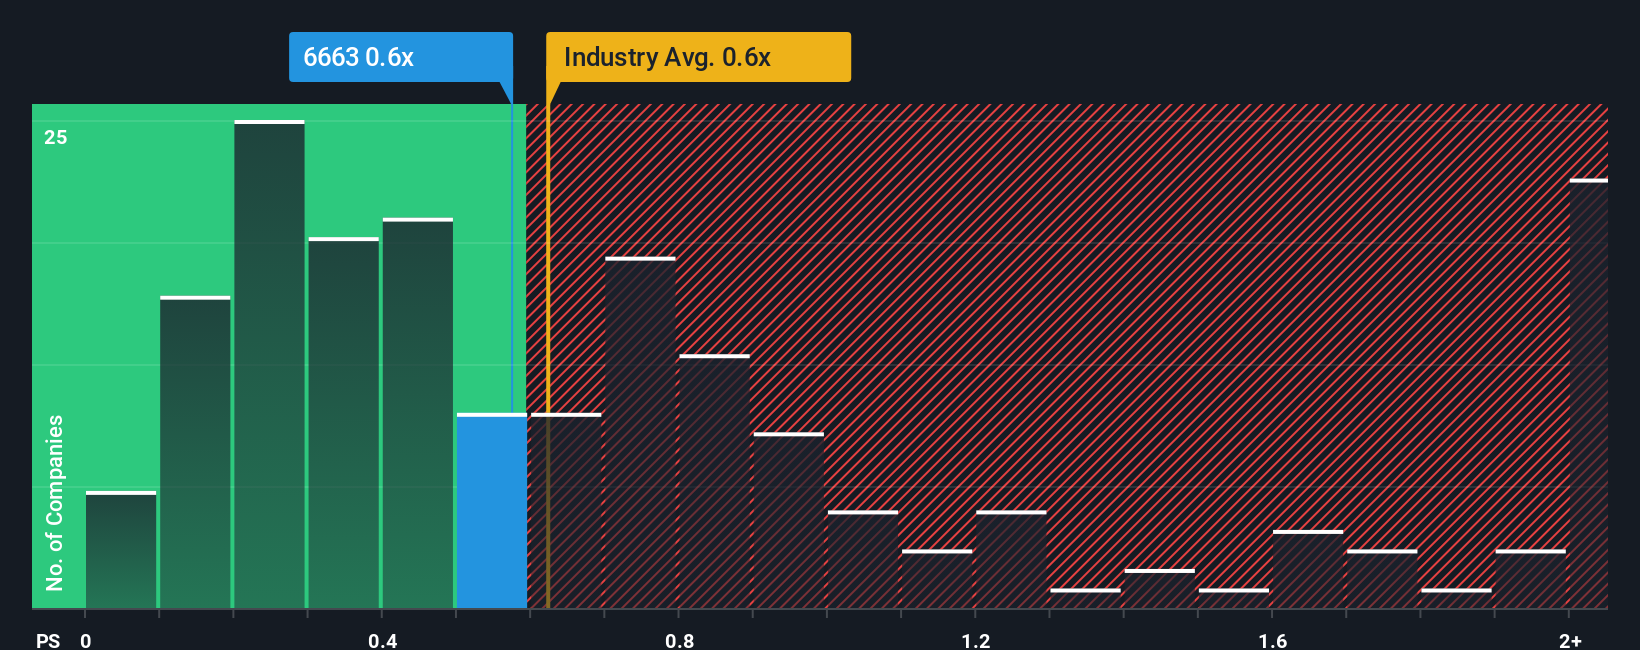
Although its price has surged higher, it's still not a stretch to say that Taiyo TechnolexLtd's price-to-sales (or "P/S") ratio of 0.6x right now seems quite "middle-of-the-road" compared to the Electronic industry in Japan, seeing as it matches the P/S ratio of the wider industry. However, investors might be overlooking a clear opportunity or potential setback if there is no rational basis for the P/S.
Check out our latest analysis for Taiyo TechnolexLtd
How Has Taiyo TechnolexLtd Performed Recently?
We'd have to say that with no tangible growth over the last year, Taiyo TechnolexLtd's revenue has been unimpressive. It might be that many expect the uninspiring revenue performance to only match most other companies at best over the coming period, which has kept the P/S from rising. Those who are bullish on Taiyo TechnolexLtd will be hoping that this isn't the case, so that they can pick up the stock at a lower valuation.
Want the full picture on earnings, revenue and cash flow for the company? Then our free report on Taiyo TechnolexLtd will help you shine a light on its historical performance.What Are Revenue Growth Metrics Telling Us About The P/S?
In order to justify its P/S ratio, Taiyo TechnolexLtd would need to produce growth that's similar to the industry.
If we review the last year of revenue, the company posted a result that saw barely any deviation from a year ago. Whilst it's an improvement, it wasn't enough to get the company out of the hole it was in, with revenue down 7.2% overall from three years ago. So unfortunately, we have to acknowledge that the company has not done a great job of growing revenue over that time.
In contrast to the company, the rest of the industry is expected to grow by 4.2% over the next year, which really puts the company's recent medium-term revenue decline into perspective.
With this in mind, we find it worrying that Taiyo TechnolexLtd's P/S exceeds that of its industry peers. Apparently many investors in the company are way less bearish than recent times would indicate and aren't willing to let go of their stock right now. There's a good chance existing shareholders are setting themselves up for future disappointment if the P/S falls to levels more in line with the recent negative growth rates.
The Final Word
Taiyo TechnolexLtd's stock has a lot of momentum behind it lately, which has brought its P/S level with the rest of the industry. Using the price-to-sales ratio alone to determine if you should sell your stock isn't sensible, however it can be a practical guide to the company's future prospects.
We find it unexpected that Taiyo TechnolexLtd trades at a P/S ratio that is comparable to the rest of the industry, despite experiencing declining revenues during the medium-term, while the industry as a whole is expected to grow. Even though it matches the industry, we're uncomfortable with the current P/S ratio, as this dismal revenue performance is unlikely to support a more positive sentiment for long. Unless the recent medium-term conditions improve markedly, investors will have a hard time accepting the share price as fair value.
Before you take the next step, you should know about the 2 warning signs for Taiyo TechnolexLtd (1 doesn't sit too well with us!) that we have uncovered.
If these risks are making you reconsider your opinion on Taiyo TechnolexLtd, explore our interactive list of high quality stocks to get an idea of what else is out there.
The New Payments ETF Is Live on NASDAQ:
Money is moving to real-time rails, and a newly listed ETF now gives investors direct exposure. Fast settlement. Institutional custody. Simple access.
Explore how this launch could reshape portfolios
Sponsored ContentValuation is complex, but we're here to simplify it.
Discover if Taiyo TechnolexLtd might be undervalued or overvalued with our detailed analysis, featuring fair value estimates, potential risks, dividends, insider trades, and its financial condition.
Access Free AnalysisHave feedback on this article? Concerned about the content? Get in touch with us directly. Alternatively, email editorial-team (at) simplywallst.com.
This article by Simply Wall St is general in nature. We provide commentary based on historical data and analyst forecasts only using an unbiased methodology and our articles are not intended to be financial advice. It does not constitute a recommendation to buy or sell any stock, and does not take account of your objectives, or your financial situation. We aim to bring you long-term focused analysis driven by fundamental data. Note that our analysis may not factor in the latest price-sensitive company announcements or qualitative material. Simply Wall St has no position in any stocks mentioned.
About TSE:6663
Taiyo TechnolexLtd
Engages in the manufacture and sale of flexible printed circuit in Japan, China, Thailand, rest of Asia, and internationally.
Flawless balance sheet and slightly overvalued.
Market Insights

Weekly Picks

THE KINGDOM OF BROWN GOODS: WHY MGPI IS BEING CRUSHED BY INVENTORY & PRIMED FOR RESURRECTION


Why Vertical Aerospace (NYSE: EVTL) is Worth Possibly Over 13x its Current Price


The Quiet Giant That Became AI’s Power Grid
Recently Updated Narratives


MINISO's fair value is projected at 26.69 with an anticipated PE ratio shift of 20x

Fiverr International will transform the freelance industry with AI-powered growth

Stride Stock: Online Education Finds Its Second Act
Popular Narratives


MicroVision will explode future revenue by 380.37% with a vision towards success


Crazy Undervalued 42 Baggers Silver Play (Active & Running Mine)


