- Japan
- /
- Electronic Equipment and Components
- /
- TSE:2760
Tokyo Electron Device's (TSE:2760) earnings growth rate lags the 53% CAGR delivered to shareholders


Tokyo Electron Device Limited (TSE:2760) shareholders might understandably be very concerned that the share price has dropped 44% in the last quarter. But over five years returns have been remarkably great. To be precise, the stock price is 604% higher than it was five years ago, a wonderful performance by any measure. So we don't think the recent decline in the share price means its story is a sad one. Only time will tell if there is still too much optimism currently reflected in the share price. It really delights us to see such great share price performance for investors.
Since the long term performance has been good but there's been a recent pullback of 8.4%, let's check if the fundamentals match the share price.
See our latest analysis for Tokyo Electron Device
There is no denying that markets are sometimes efficient, but prices do not always reflect underlying business performance. By comparing earnings per share (EPS) and share price changes over time, we can get a feel for how investor attitudes to a company have morphed over time.
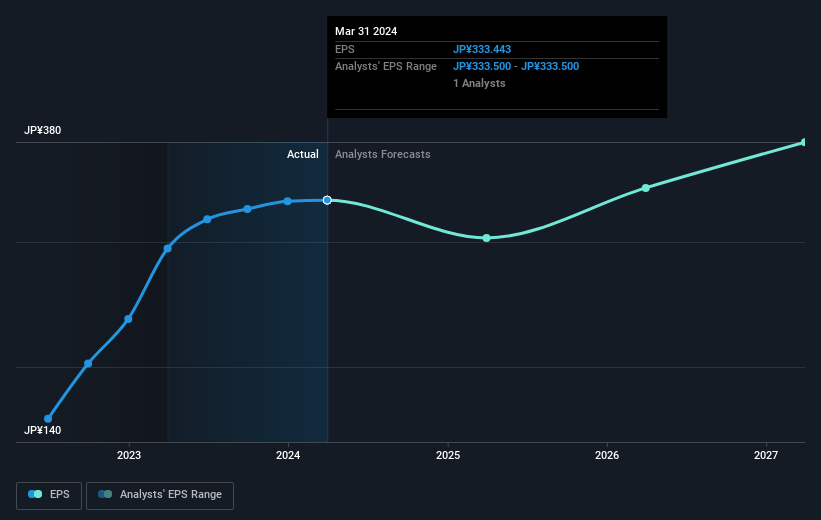
Over half a decade, Tokyo Electron Device managed to grow its earnings per share at 35% a year. This EPS growth is slower than the share price growth of 48% per year, over the same period. This suggests that market participants hold the company in higher regard, these days. That's not necessarily surprising considering the five-year track record of earnings growth.
You can see how EPS has changed over time in the image below (click on the chart to see the exact values).
We know that Tokyo Electron Device has improved its bottom line over the last three years, but what does the future have in store? You can see how its balance sheet has strengthened (or weakened) over time in this free interactive graphic.
What About Dividends?
It is important to consider the total shareholder return, as well as the share price return, for any given stock. The TSR incorporates the value of any spin-offs or discounted capital raisings, along with any dividends, based on the assumption that the dividends are reinvested. Arguably, the TSR gives a more comprehensive picture of the return generated by a stock. We note that for Tokyo Electron Device the TSR over the last 5 years was 748%, which is better than the share price return mentioned above. And there's no prize for guessing that the dividend payments largely explain the divergence!
A Different Perspective
We're pleased to report that Tokyo Electron Device shareholders have received a total shareholder return of 32% over one year. That's including the dividend. However, that falls short of the 53% TSR per annum it has made for shareholders, each year, over five years. Potential buyers might understandably feel they've missed the opportunity, but it's always possible business is still firing on all cylinders. I find it very interesting to look at share price over the long term as a proxy for business performance. But to truly gain insight, we need to consider other information, too. For instance, we've identified 3 warning signs for Tokyo Electron Device (1 can't be ignored) that you should be aware of.
If you like to buy stocks alongside management, then you might just love this free list of companies. (Hint: many of them are unnoticed AND have attractive valuation).
Please note, the market returns quoted in this article reflect the market weighted average returns of stocks that currently trade on Japanese exchanges.
Valuation is complex, but we're here to simplify it.
Discover if Tokyo Electron Device might be undervalued or overvalued with our detailed analysis, featuring fair value estimates, potential risks, dividends, insider trades, and its financial condition.
Access Free AnalysisHave feedback on this article? Concerned about the content? Get in touch with us directly. Alternatively, email editorial-team (at) simplywallst.com.
This article by Simply Wall St is general in nature. We provide commentary based on historical data and analyst forecasts only using an unbiased methodology and our articles are not intended to be financial advice. It does not constitute a recommendation to buy or sell any stock, and does not take account of your objectives, or your financial situation. We aim to bring you long-term focused analysis driven by fundamental data. Note that our analysis may not factor in the latest price-sensitive company announcements or qualitative material. Simply Wall St has no position in any stocks mentioned.
About TSE:2760
Tokyo Electron Device
A technology trading company, engages in the electronic components and computer networks businesses worldwide.
Adequate balance sheet average dividend payer.
Market Insights

Community Narratives
