- Japan
- /
- Electronic Equipment and Components
- /
- TSE:6629
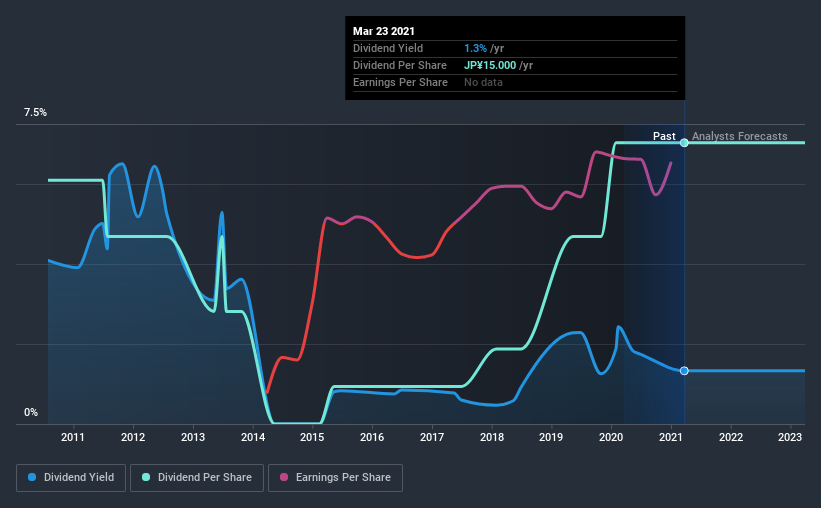
Shareholders Are Loving Techno Horizon Co.,Ltd.'s (TYO:6629) 1.3% Yield

Is Techno Horizon Co.,Ltd. (TYO:6629) a good dividend stock? How can we tell? Dividend paying companies with growing earnings can be highly rewarding in the long term. On the other hand, investors have been known to buy a stock because of its yield, and then lose money if the company's dividend doesn't live up to expectations.
A 1.3% yield is nothing to get excited about, but investors probably think the long payment history suggests Techno HorizonLtd has some staying power. That said, the recent jump in the share price will make Techno HorizonLtd's dividend yield look smaller, even though the company prospects could be improving. Some simple analysis can reduce the risk of holding Techno HorizonLtd for its dividend, and we'll focus on the most important aspects below.
Explore this interactive chart for our latest analysis on Techno HorizonLtd!
Payout ratios
Dividends are typically paid from company earnings. If a company pays more in dividends than it earned, then the dividend might become unsustainable - hardly an ideal situation. Comparing dividend payments to a company's net profit after tax is a simple way of reality-checking whether a dividend is sustainable. Techno HorizonLtd paid out 16% of its profit as dividends, over the trailing twelve month period. Given the low payout ratio, it is hard to envision the dividend coming under threat, barring a catastrophe.
We also measure dividends paid against a company's levered free cash flow, to see if enough cash was generated to cover the dividend. Techno HorizonLtd's cash payout ratio last year was 3.2%. Cash flows are typically lumpy, but this looks like an appropriately conservative payout. It's positive to see that Techno HorizonLtd's dividend is covered by both profits and cash flow, since this is generally a sign that the dividend is sustainable, and a lower payout ratio usually suggests a greater margin of safety before the dividend gets cut.
Consider getting our latest analysis on Techno HorizonLtd's financial position here.
Dividend Volatility
Before buying a stock for its income, we want to see if the dividends have been stable in the past, and if the company has a track record of maintaining its dividend. Techno HorizonLtd has been paying dividends for a long time, but for the purpose of this analysis, we only examine the past 10 years of payments. This dividend has been unstable, which we define as having been cut one or more times over this time. During the past 10-year period, the first annual payment was JP¥13.0 in 2011, compared to JP¥15.0 last year. This works out to be a compound annual growth rate (CAGR) of approximately 1.4% a year over that time. Techno HorizonLtd's dividend payments have fluctuated, so it hasn't grown 1.4% every year, but the CAGR is a useful rule of thumb for approximating the historical growth.
Modest growth in the dividend is good to see, but we think this is offset by historical cuts to the payments. It is hard to live on a dividend income if the company's earnings are not consistent.
Dividend Growth Potential
With a relatively unstable dividend, it's even more important to see if earnings per share (EPS) are growing. Why take the risk of a dividend getting cut, unless there's a good chance of bigger dividends in future? Strong earnings per share (EPS) growth might encourage our interest in the company despite fluctuating dividends, which is why it's great to see Techno HorizonLtd has grown its earnings per share at 95% per annum over the past five years. Earnings per share have grown rapidly, and the company is retaining a majority of its earnings. We think this is ideal from an investment perspective, if the company is able to reinvest these earnings effectively.
Conclusion
To summarise, shareholders should always check that Techno HorizonLtd's dividends are affordable, that its dividend payments are relatively stable, and that it has decent prospects for growing its earnings and dividend. It's great to see that Techno HorizonLtd is paying out a low percentage of its earnings and cash flow. Next, earnings growth has been good, but unfortunately the dividend has been cut at least once in the past. All things considered, Techno HorizonLtd looks like a strong prospect. At the right valuation, it could be something special.
Investors generally tend to favour companies with a consistent, stable dividend policy as opposed to those operating an irregular one. However, there are other things to consider for investors when analysing stock performance. Case in point: We've spotted 3 warning signs for Techno HorizonLtd (of which 1 is concerning!) you should know about.
If you are a dividend investor, you might also want to look at our curated list of dividend stocks yielding above 3%.
If you’re looking to trade Techno HorizonLtd, open an account with the lowest-cost* platform trusted by professionals, Interactive Brokers. Their clients from over 200 countries and territories trade stocks, options, futures, forex, bonds and funds worldwide from a single integrated account. Promoted
The New Payments ETF Is Live on NASDAQ:
Money is moving to real-time rails, and a newly listed ETF now gives investors direct exposure. Fast settlement. Institutional custody. Simple access.
Explore how this launch could reshape portfolios
Sponsored ContentValuation is complex, but we're here to simplify it.
Discover if Techno HorizonLtd might be undervalued or overvalued with our detailed analysis, featuring fair value estimates, potential risks, dividends, insider trades, and its financial condition.
Access Free AnalysisThis article by Simply Wall St is general in nature. It does not constitute a recommendation to buy or sell any stock, and does not take account of your objectives, or your financial situation. We aim to bring you long-term focused analysis driven by fundamental data. Note that our analysis may not factor in the latest price-sensitive company announcements or qualitative material. Simply Wall St has no position in any stocks mentioned.
*Interactive Brokers Rated Lowest Cost Broker by StockBrokers.com Annual Online Review 2020
Have feedback on this article? Concerned about the content? Get in touch with us directly. Alternatively, email editorial-team (at) simplywallst.com.
About TSE:6629
Techno HorizonLtd
Manufactures and sells products in Video and IT, and robotics categories in Japan, North America, China, Singapore, the Rest of Asia, and internationally.
Medium-low risk with adequate balance sheet.
Market Insights

Weekly Picks

THE KINGDOM OF BROWN GOODS: WHY MGPI IS BEING CRUSHED BY INVENTORY & PRIMED FOR RESURRECTION


Why Vertical Aerospace (NYSE: EVTL) is Worth Possibly Over 13x its Current Price


The Quiet Giant That Became AI’s Power Grid
Recently Updated Narratives

Butler National (Buks) outperforms.


A tech powerhouse quietly powering the world’s AI infrastructure.


Keppel DC REIT (SGX: AJBU) is a resilient gem in the data center space.
Popular Narratives

MicroVision will explode future revenue by 380.37% with a vision towards success


Crazy Undervalued 42 Baggers Silver Play (Active & Running Mine)


