
Advertisement
Are Robust Financials Driving The Recent Rally In SCSK Corporation's (TSE:9719) Stock?

SCSK's (TSE:9719) stock is up by a considerable 14% over the past three months. Since the market usually pay for a company’s long-term fundamentals, we decided to study the company’s key performance indicators to see if they could be influencing the market. In this article, we decided to focus on SCSK's ROE.
Return on equity or ROE is a key measure used to assess how efficiently a company's management is utilizing the company's capital. In simpler terms, it measures the profitability of a company in relation to shareholder's equity.
Our free stock report includes 1 warning sign investors should be aware of before investing in SCSK. Read for free now.How Is ROE Calculated?
Return on equity can be calculated by using the formula:
Return on Equity = Net Profit (from continuing operations) ÷ Shareholders' Equity
So, based on the above formula, the ROE for SCSK is:
13% = JP¥42b ÷ JP¥330b (Based on the trailing twelve months to December 2024).
The 'return' is the profit over the last twelve months. That means that for every ¥1 worth of shareholders' equity, the company generated ¥0.13 in profit.
Check out our latest analysis for SCSK
What Has ROE Got To Do With Earnings Growth?
Thus far, we have learned that ROE measures how efficiently a company is generating its profits. Depending on how much of these profits the company reinvests or "retains", and how effectively it does so, we are then able to assess a company’s earnings growth potential. Assuming all else is equal, companies that have both a higher return on equity and higher profit retention are usually the ones that have a higher growth rate when compared to companies that don't have the same features.
A Side By Side comparison of SCSK's Earnings Growth And 13% ROE
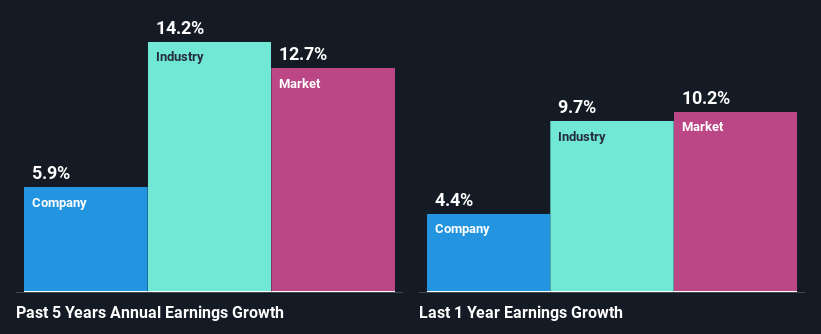
At first glance, SCSK seems to have a decent ROE. Further, the company's ROE is similar to the industry average of 14%. This certainly adds some context to SCSK's moderate 5.9% net income growth seen over the past five years.
As a next step, we compared SCSK's net income growth with the industry and were disappointed to see that the company's growth is lower than the industry average growth of 14% in the same period.
Earnings growth is a huge factor in stock valuation. The investor should try to establish if the expected growth or decline in earnings, whichever the case may be, is priced in. By doing so, they will have an idea if the stock is headed into clear blue waters or if swampy waters await. If you're wondering about SCSK's's valuation, check out this gauge of its price-to-earnings ratio, as compared to its industry.
Is SCSK Making Efficient Use Of Its Profits?
SCSK has a healthy combination of a moderate three-year median payout ratio of 44% (or a retention ratio of 56%) and a respectable amount of growth in earnings as we saw above, meaning that the company has been making efficient use of its profits.
Moreover, SCSK is determined to keep sharing its profits with shareholders which we infer from its long history of paying a dividend for at least ten years.
Summary
On the whole, we feel that SCSK's performance has been quite good. Specifically, we like that the company is reinvesting a huge chunk of its profits at a high rate of return. This of course has caused the company to see a good amount of growth in its earnings. That being so, the latest analyst forecasts show that the company will continue to see an expansion in its earnings. To know more about the latest analysts predictions for the company, check out this visualization of analyst forecasts for the company.
New: Manage All Your Stock Portfolios in One Place
We've created the ultimate portfolio companion for stock investors, and it's free.
• Connect an unlimited number of Portfolios and see your total in one currency
• Be alerted to new Warning Signs or Risks via email or mobile
• Track the Fair Value of your stocks
Have feedback on this article? Concerned about the content? Get in touch with us directly. Alternatively, email editorial-team (at) simplywallst.com.
This article by Simply Wall St is general in nature. We provide commentary based on historical data and analyst forecasts only using an unbiased methodology and our articles are not intended to be financial advice. It does not constitute a recommendation to buy or sell any stock, and does not take account of your objectives, or your financial situation. We aim to bring you long-term focused analysis driven by fundamental data. Note that our analysis may not factor in the latest price-sensitive company announcements or qualitative material. Simply Wall St has no position in any stocks mentioned.
About TSE:9719
SCSK
Provides information technology (IT) services in Japan and internationally.
Established dividend payer with moderate growth potential.
Similar Companies
Market Insights

Advertisement
Community Narratives
RIO is poised to weather a depressed iron ore environment, but commodity diversification comes with lower margins
Fair Value AU$110.51|4.0% overvalued
DU
Community Contributor
The demand for personalized medicine will keep Thermo Fisher Scientific thriving
Fair Value US$540.27|20.1% undervalued
UN
Community Contributor
Silver Play by A Family with 10x Potential
Fair Value UK£24.00|88.5% undervalued
RO
Community Contributor