

Howard Marks put it nicely when he said that, rather than worrying about share price volatility, 'The possibility of permanent loss is the risk I worry about... and every practical investor I know worries about.' It's only natural to consider a company's balance sheet when you examine how risky it is, since debt is often involved when a business collapses. We can see that Otsuka Corporation (TSE:4768) does use debt in its business. But the more important question is: how much risk is that debt creating?
When Is Debt A Problem?
Generally speaking, debt only becomes a real problem when a company can't easily pay it off, either by raising capital or with its own cash flow. Ultimately, if the company can't fulfill its legal obligations to repay debt, shareholders could walk away with nothing. However, a more frequent (but still costly) occurrence is where a company must issue shares at bargain-basement prices, permanently diluting shareholders, just to shore up its balance sheet. Having said that, the most common situation is where a company manages its debt reasonably well - and to its own advantage. When we think about a company's use of debt, we first look at cash and debt together.
See our latest analysis for Otsuka
What Is Otsuka's Debt?
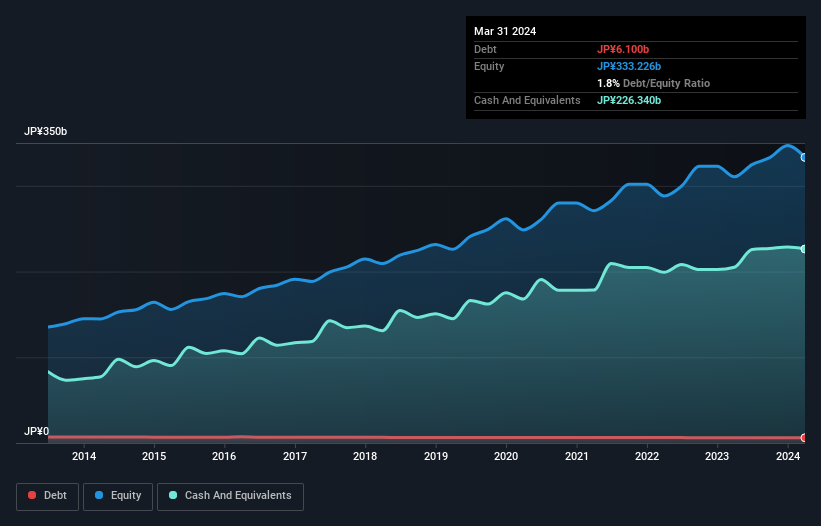
The chart below, which you can click on for greater detail, shows that Otsuka had JP¥6.10b in debt in March 2024; about the same as the year before. However, its balance sheet shows it holds JP¥226.3b in cash, so it actually has JP¥220.2b net cash.
How Strong Is Otsuka's Balance Sheet?
We can see from the most recent balance sheet that Otsuka had liabilities of JP¥245.0b falling due within a year, and liabilities of JP¥12.1b due beyond that. Offsetting these obligations, it had cash of JP¥226.3b as well as receivables valued at JP¥187.4b due within 12 months. So it can boast JP¥156.6b more liquid assets than total liabilities.
This short term liquidity is a sign that Otsuka could probably pay off its debt with ease, as its balance sheet is far from stretched. Succinctly put, Otsuka boasts net cash, so it's fair to say it does not have a heavy debt load!
The good news is that Otsuka has increased its EBIT by 9.4% over twelve months, which should ease any concerns about debt repayment. When analysing debt levels, the balance sheet is the obvious place to start. But ultimately the future profitability of the business will decide if Otsuka can strengthen its balance sheet over time. So if you're focused on the future you can check out this free report showing analyst profit forecasts.
Finally, a company can only pay off debt with cold hard cash, not accounting profits. While Otsuka has net cash on its balance sheet, it's still worth taking a look at its ability to convert earnings before interest and tax (EBIT) to free cash flow, to help us understand how quickly it is building (or eroding) that cash balance. During the last three years, Otsuka produced sturdy free cash flow equating to 76% of its EBIT, about what we'd expect. This cold hard cash means it can reduce its debt when it wants to.
Summing Up
While we empathize with investors who find debt concerning, you should keep in mind that Otsuka has net cash of JP¥220.2b, as well as more liquid assets than liabilities. The cherry on top was that in converted 76% of that EBIT to free cash flow, bringing in JP¥59b. So we don't think Otsuka's use of debt is risky. Over time, share prices tend to follow earnings per share, so if you're interested in Otsuka, you may well want to click here to check an interactive graph of its earnings per share history.
When all is said and done, sometimes its easier to focus on companies that don't even need debt. Readers can access a list of growth stocks with zero net debt 100% free, right now.
New: AI Stock Screener & Alerts
Our new AI Stock Screener scans the market every day to uncover opportunities.
• Dividend Powerhouses (3%+ Yield)
• Undervalued Small Caps with Insider Buying
• High growth Tech and AI Companies
Or build your own from over 50 metrics.
Have feedback on this article? Concerned about the content? Get in touch with us directly. Alternatively, email editorial-team (at) simplywallst.com.
This article by Simply Wall St is general in nature. We provide commentary based on historical data and analyst forecasts only using an unbiased methodology and our articles are not intended to be financial advice. It does not constitute a recommendation to buy or sell any stock, and does not take account of your objectives, or your financial situation. We aim to bring you long-term focused analysis driven by fundamental data. Note that our analysis may not factor in the latest price-sensitive company announcements or qualitative material. Simply Wall St has no position in any stocks mentioned.
About TSE:4768
Flawless balance sheet with solid track record and pays a dividend.
Market Insights

Community Narratives
