
Advertisement
Legendary fund manager Li Lu (who Charlie Munger backed) once said, 'The biggest investment risk is not the volatility of prices, but whether you will suffer a permanent loss of capital.' So it seems the smart money knows that debt - which is usually involved in bankruptcies - is a very important factor, when you assess how risky a company is. We can see that Collabos Corporation (TSE:3908) does use debt in its business. But the more important question is: how much risk is that debt creating?
When Is Debt Dangerous?
Debt is a tool to help businesses grow, but if a business is incapable of paying off its lenders, then it exists at their mercy. Ultimately, if the company can't fulfill its legal obligations to repay debt, shareholders could walk away with nothing. However, a more frequent (but still costly) occurrence is where a company must issue shares at bargain-basement prices, permanently diluting shareholders, just to shore up its balance sheet. Of course, debt can be an important tool in businesses, particularly capital heavy businesses. When we think about a company's use of debt, we first look at cash and debt together.
Check out our latest analysis for Collabos
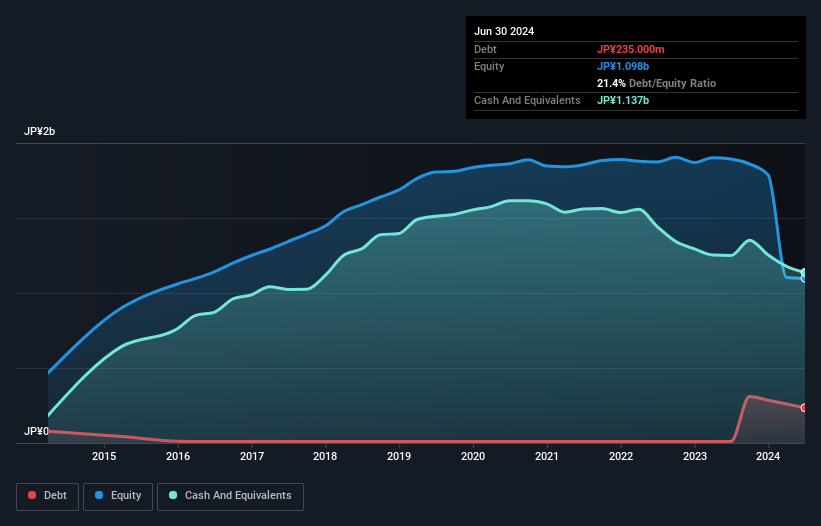
How Much Debt Does Collabos Carry?
The image below, which you can click on for greater detail, shows that at June 2024 Collabos had debt of JP¥235.0m, up from JP¥10.0m in one year. However, it does have JP¥1.14b in cash offsetting this, leading to net cash of JP¥902.0m.
A Look At Collabos' Liabilities
Zooming in on the latest balance sheet data, we can see that Collabos had liabilities of JP¥324.0m due within 12 months and liabilities of JP¥241.0m due beyond that. Offsetting this, it had JP¥1.14b in cash and JP¥182.0m in receivables that were due within 12 months. So it can boast JP¥754.0m more liquid assets than total liabilities.
This luscious liquidity implies that Collabos' balance sheet is sturdy like a giant sequoia tree. With this in mind one could posit that its balance sheet means the company is able to handle some adversity. Simply put, the fact that Collabos has more cash than debt is arguably a good indication that it can manage its debt safely. The balance sheet is clearly the area to focus on when you are analysing debt. But it is Collabos's earnings that will influence how the balance sheet holds up in the future. So if you're keen to discover more about its earnings, it might be worth checking out this graph of its long term earnings trend.
In the last year Collabos had a loss before interest and tax, and actually shrunk its revenue by 10%, to JP¥2.1b. We would much prefer see growth.
So How Risky Is Collabos?
We have no doubt that loss making companies are, in general, riskier than profitable ones. And in the last year Collabos had an earnings before interest and tax (EBIT) loss, truth be told. And over the same period it saw negative free cash outflow of JP¥256m and booked a JP¥794m accounting loss. Given it only has net cash of JP¥902.0m, the company may need to raise more capital if it doesn't reach break-even soon. Even though its balance sheet seems sufficiently liquid, debt always makes us a little nervous if a company doesn't produce free cash flow regularly. When analysing debt levels, the balance sheet is the obvious place to start. However, not all investment risk resides within the balance sheet - far from it. For instance, we've identified 2 warning signs for Collabos (1 makes us a bit uncomfortable) you should be aware of.
If you're interested in investing in businesses that can grow profits without the burden of debt, then check out this free list of growing businesses that have net cash on the balance sheet.
New: AI Stock Screener & Alerts
Our new AI Stock Screener scans the market every day to uncover opportunities.
• Dividend Powerhouses (3%+ Yield)
• Undervalued Small Caps with Insider Buying
• High growth Tech and AI Companies
Or build your own from over 50 metrics.
Have feedback on this article? Concerned about the content? Get in touch with us directly. Alternatively, email editorial-team (at) simplywallst.com.
This article by Simply Wall St is general in nature. We provide commentary based on historical data and analyst forecasts only using an unbiased methodology and our articles are not intended to be financial advice. It does not constitute a recommendation to buy or sell any stock, and does not take account of your objectives, or your financial situation. We aim to bring you long-term focused analysis driven by fundamental data. Note that our analysis may not factor in the latest price-sensitive company announcements or qualitative material. Simply Wall St has no position in any stocks mentioned.
About TSE:3908
Excellent balance sheet with slight risk.
Market Insights

Advertisement
Community Narratives
A formidable player in AI and enterprise computing.
Fair Value US$210.00|12.2% overvalued
CO
Community Contributor
IREN's Bold Moves in Sustainable Bitcoin Mining & AI Data Centers
Fair Value US$72.52|17.1% undervalued
BL
Community Contributor
Cooling the Champions: The Aussie Tech Behind F1's Victories
Fair Value AU$12.40|38.7% undervalued
TR
Community Contributor