
Advertisement
- Japan
- /
- Real Estate
- /
- TSE:8919
Are Strong Financial Prospects The Force That Is Driving The Momentum In KATITAS CO., Ltd.'s TSE:8919) Stock?
KATITAS (TSE:8919) has had a great run on the share market with its stock up by a significant 21% over the last three months. Since the market usually pay for a company’s long-term fundamentals, we decided to study the company’s key performance indicators to see if they could be influencing the market. In this article, we decided to focus on KATITAS' ROE.
ROE or return on equity is a useful tool to assess how effectively a company can generate returns on the investment it received from its shareholders. In simpler terms, it measures the profitability of a company in relation to shareholder's equity.
How Is ROE Calculated?
ROE can be calculated by using the formula:
Return on Equity = Net Profit (from continuing operations) ÷ Shareholders' Equity
So, based on the above formula, the ROE for KATITAS is:
22% = JP¥10b ÷ JP¥46b (Based on the trailing twelve months to June 2025).
The 'return' is the yearly profit. That means that for every ¥1 worth of shareholders' equity, the company generated ¥0.22 in profit.
Check out our latest analysis for KATITAS
What Has ROE Got To Do With Earnings Growth?
So far, we've learned that ROE is a measure of a company's profitability. Based on how much of its profits the company chooses to reinvest or "retain", we are then able to evaluate a company's future ability to generate profits. Generally speaking, other things being equal, firms with a high return on equity and profit retention, have a higher growth rate than firms that don’t share these attributes.
A Side By Side comparison of KATITAS' Earnings Growth And 22% ROE
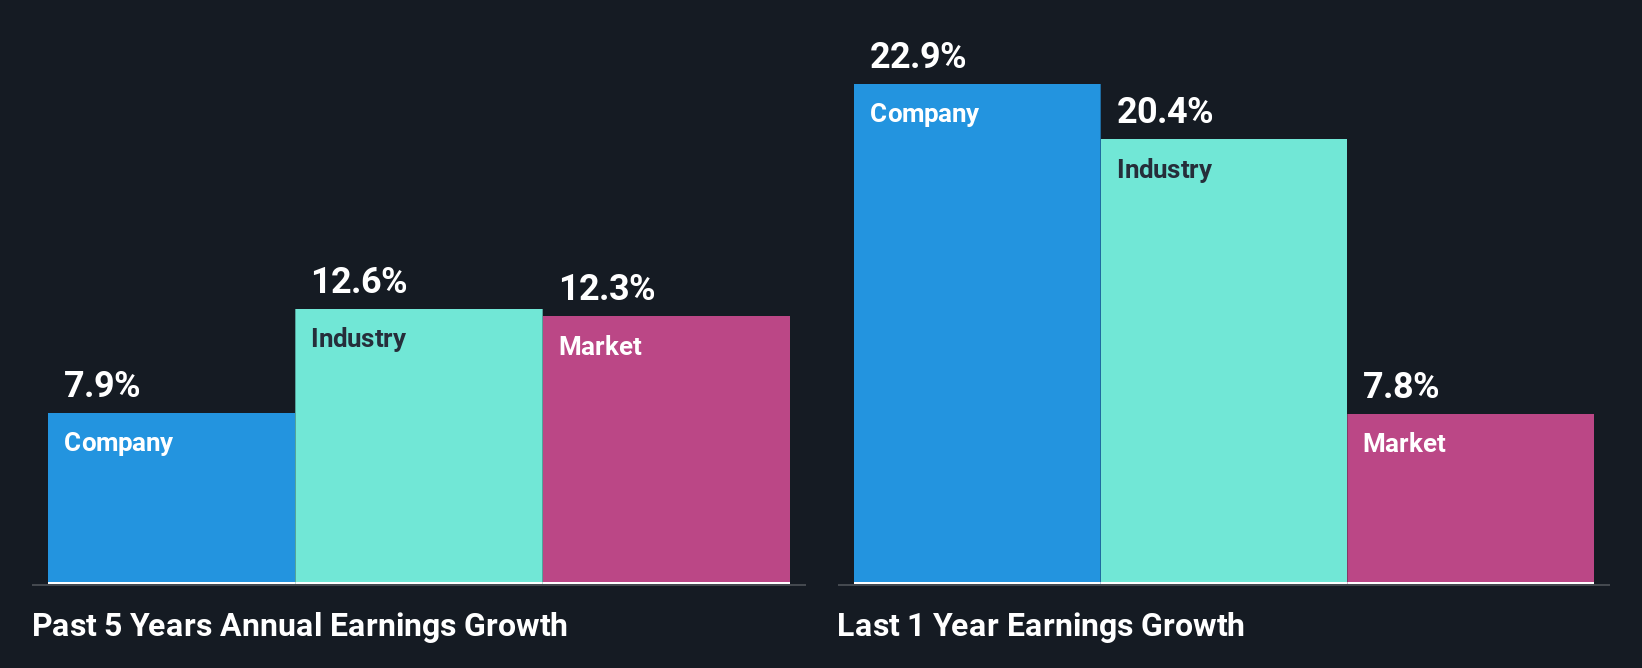
To begin with, KATITAS has a pretty high ROE which is interesting. Additionally, the company's ROE is higher compared to the industry average of 12% which is quite remarkable. Probably as a result of this, KATITAS was able to see a decent net income growth of 7.9% over the last five years.
We then compared KATITAS' net income growth with the industry and found that the company's growth figure is lower than the average industry growth rate of 13% in the same 5-year period, which is a bit concerning.
Earnings growth is a huge factor in stock valuation. The investor should try to establish if the expected growth or decline in earnings, whichever the case may be, is priced in. By doing so, they will have an idea if the stock is headed into clear blue waters or if swampy waters await. If you're wondering about KATITAS''s valuation, check out this gauge of its price-to-earnings ratio, as compared to its industry.
Is KATITAS Efficiently Re-investing Its Profits?
KATITAS has a healthy combination of a moderate three-year median payout ratio of 47% (or a retention ratio of 53%) and a respectable amount of growth in earnings as we saw above, meaning that the company has been making efficient use of its profits.
Moreover, KATITAS is determined to keep sharing its profits with shareholders which we infer from its long history of eight years of paying a dividend.
Conclusion
On the whole, we feel that KATITAS' performance has been quite good. Specifically, we like that the company is reinvesting a huge chunk of its profits at a high rate of return. This of course has caused the company to see a good amount of growth in its earnings. On studying current analyst estimates, we found that analysts expect the company to continue its recent growth streak. To know more about the latest analysts predictions for the company, check out this visualization of analyst forecasts for the company.
Valuation is complex, but we're here to simplify it.
Discover if KATITAS might be undervalued or overvalued with our detailed analysis, featuring fair value estimates, potential risks, dividends, insider trades, and its financial condition.
Access Free AnalysisHave feedback on this article? Concerned about the content? Get in touch with us directly. Alternatively, email editorial-team (at) simplywallst.com.
This article by Simply Wall St is general in nature. We provide commentary based on historical data and analyst forecasts only using an unbiased methodology and our articles are not intended to be financial advice. It does not constitute a recommendation to buy or sell any stock, and does not take account of your objectives, or your financial situation. We aim to bring you long-term focused analysis driven by fundamental data. Note that our analysis may not factor in the latest price-sensitive company announcements or qualitative material. Simply Wall St has no position in any stocks mentioned.
About TSE:8919
KATITAS
KATITAS CO., Ltd. surveys, purchases, refurbishes, remodels, and sells used homes to individuals and families in Japan.
Outstanding track record with excellent balance sheet.
Market Insights


Advertisement
Community Narratives
100% Patient Improvement in trial puts this $16M Biotech on the radar
Fair Value US$5.30|75.8% undervalued
JO
Community Contributor
PayPal's Future Growth Through Venmo and Merchant Solutions
Fair Value US$105.25|33.3% undervalued
ZW
Community Contributor
IREN's Bold Moves in Sustainable Bitcoin Mining & AI Data Centers
Fair Value US$26.54|9.7% overvalued
BL
Community Contributor