

Some say volatility, rather than debt, is the best way to think about risk as an investor, but Warren Buffett famously said that 'Volatility is far from synonymous with risk.' It's only natural to consider a company's balance sheet when you examine how risky it is, since debt is often involved when a business collapses. As with many other companies Capcom Co., Ltd. (TSE:9697) makes use of debt. But the more important question is: how much risk is that debt creating?
When Is Debt A Problem?
Generally speaking, debt only becomes a real problem when a company can't easily pay it off, either by raising capital or with its own cash flow. Part and parcel of capitalism is the process of 'creative destruction' where failed businesses are mercilessly liquidated by their bankers. While that is not too common, we often do see indebted companies permanently diluting shareholders because lenders force them to raise capital at a distressed price. Having said that, the most common situation is where a company manages its debt reasonably well - and to its own advantage. When we examine debt levels, we first consider both cash and debt levels, together.
See our latest analysis for Capcom
What Is Capcom's Net Debt?
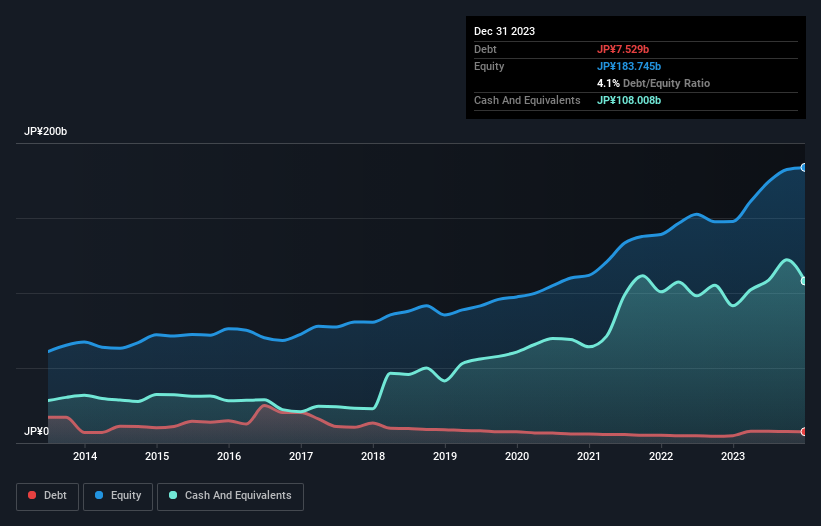
As you can see below, at the end of December 2023, Capcom had JP¥7.53b of debt, up from JP¥4.91b a year ago. Click the image for more detail. But it also has JP¥108.0b in cash to offset that, meaning it has JP¥100.5b net cash.
How Healthy Is Capcom's Balance Sheet?
We can see from the most recent balance sheet that Capcom had liabilities of JP¥27.0b falling due within a year, and liabilities of JP¥12.1b due beyond that. Offsetting these obligations, it had cash of JP¥108.0b as well as receivables valued at JP¥12.5b due within 12 months. So it can boast JP¥81.3b more liquid assets than total liabilities.
This surplus suggests that Capcom has a conservative balance sheet, and could probably eliminate its debt without much difficulty. Succinctly put, Capcom boasts net cash, so it's fair to say it does not have a heavy debt load!
In addition to that, we're happy to report that Capcom has boosted its EBIT by 58%, thus reducing the spectre of future debt repayments. When analysing debt levels, the balance sheet is the obvious place to start. But it is future earnings, more than anything, that will determine Capcom's ability to maintain a healthy balance sheet going forward. So if you want to see what the professionals think, you might find this free report on analyst profit forecasts to be interesting.
Finally, a business needs free cash flow to pay off debt; accounting profits just don't cut it. While Capcom has net cash on its balance sheet, it's still worth taking a look at its ability to convert earnings before interest and tax (EBIT) to free cash flow, to help us understand how quickly it is building (or eroding) that cash balance. During the last three years, Capcom produced sturdy free cash flow equating to 53% of its EBIT, about what we'd expect. This cold hard cash means it can reduce its debt when it wants to.
Summing Up
While we empathize with investors who find debt concerning, you should keep in mind that Capcom has net cash of JP¥100.5b, as well as more liquid assets than liabilities. And it impressed us with its EBIT growth of 58% over the last year. So we don't think Capcom's use of debt is risky. The balance sheet is clearly the area to focus on when you are analysing debt. But ultimately, every company can contain risks that exist outside of the balance sheet. For example, we've discovered 1 warning sign for Capcom that you should be aware of before investing here.
Of course, if you're the type of investor who prefers buying stocks without the burden of debt, then don't hesitate to discover our exclusive list of net cash growth stocks, today.
If you're looking to trade Capcom, open an account with the lowest-cost platform trusted by professionals, Interactive Brokers.
With clients in over 200 countries and territories, and access to 160 markets, IBKR lets you trade stocks, options, futures, forex, bonds and funds from a single integrated account.
Enjoy no hidden fees, no account minimums, and FX conversion rates as low as 0.03%, far better than what most brokers offer.
Sponsored ContentNew: AI Stock Screener & Alerts
Our new AI Stock Screener scans the market every day to uncover opportunities.
• Dividend Powerhouses (3%+ Yield)
• Undervalued Small Caps with Insider Buying
• High growth Tech and AI Companies
Or build your own from over 50 metrics.
Have feedback on this article? Concerned about the content? Get in touch with us directly. Alternatively, email editorial-team (at) simplywallst.com.
This article by Simply Wall St is general in nature. We provide commentary based on historical data and analyst forecasts only using an unbiased methodology and our articles are not intended to be financial advice. It does not constitute a recommendation to buy or sell any stock, and does not take account of your objectives, or your financial situation. We aim to bring you long-term focused analysis driven by fundamental data. Note that our analysis may not factor in the latest price-sensitive company announcements or qualitative material. Simply Wall St has no position in any stocks mentioned.
About TSE:9697
Capcom
Plans, develops, manufactures, sells, and distributes home video games, online games, mobile games, and arcade games in Japan and internationally.
Flawless balance sheet with moderate growth potential.
Similar Companies
Market Insights

Community Narratives
