

What are the early trends we should look for to identify a stock that could multiply in value over the long term? Firstly, we'll want to see a proven return on capital employed (ROCE) that is increasing, and secondly, an expanding base of capital employed. If you see this, it typically means it's a company with a great business model and plenty of profitable reinvestment opportunities. However, after investigating HYOJITO (TSE:7368), we don't think it's current trends fit the mold of a multi-bagger.
Understanding Return On Capital Employed (ROCE)
Just to clarify if you're unsure, ROCE is a metric for evaluating how much pre-tax income (in percentage terms) a company earns on the capital invested in its business. To calculate this metric for HYOJITO, this is the formula:
Return on Capital Employed = Earnings Before Interest and Tax (EBIT) ÷ (Total Assets - Current Liabilities)
0.13 = JP¥994m ÷ (JP¥14b - JP¥6.1b) (Based on the trailing twelve months to December 2024).
Therefore, HYOJITO has an ROCE of 13%. On its own, that's a standard return, however it's much better than the 9.4% generated by the Media industry.
See our latest analysis for HYOJITO
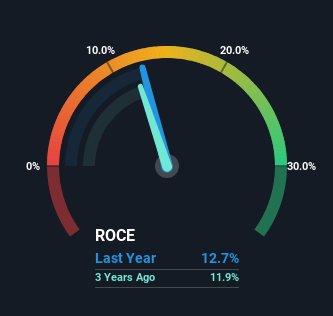
Historical performance is a great place to start when researching a stock so above you can see the gauge for HYOJITO's ROCE against it's prior returns. If you'd like to look at how HYOJITO has performed in the past in other metrics, you can view this free graph of HYOJITO's past earnings, revenue and cash flow .
What Does the ROCE Trend For HYOJITO Tell Us?
When we looked at the ROCE trend at HYOJITO, we didn't gain much confidence. To be more specific, ROCE has fallen from 20% over the last five years. However it looks like HYOJITO might be reinvesting for long term growth because while capital employed has increased, the company's sales haven't changed much in the last 12 months. It may take some time before the company starts to see any change in earnings from these investments.
On a related note, HYOJITO has decreased its current liabilities to 44% of total assets. That could partly explain why the ROCE has dropped. What's more, this can reduce some aspects of risk to the business because now the company's suppliers or short-term creditors are funding less of its operations. Since the business is basically funding more of its operations with it's own money, you could argue this has made the business less efficient at generating ROCE. Keep in mind 44% is still pretty high, so those risks are still somewhat prevalent.
The Bottom Line
Bringing it all together, while we're somewhat encouraged by HYOJITO's reinvestment in its own business, we're aware that returns are shrinking. Since the stock has gained an impressive 23% over the last three years, investors must think there's better things to come. However, unless these underlying trends turn more positive, we wouldn't get our hopes up too high.
HYOJITO does have some risks, we noticed 2 warning signs (and 1 which can't be ignored) we think you should know about.
If you want to search for solid companies with great earnings, check out this free list of companies with good balance sheets and impressive returns on equity.
If you're looking to trade HYOJITO, open an account with the lowest-cost platform trusted by professionals, Interactive Brokers.
With clients in over 200 countries and territories, and access to 160 markets, IBKR lets you trade stocks, options, futures, forex, bonds and funds from a single integrated account.
Enjoy no hidden fees, no account minimums, and FX conversion rates as low as 0.03%, far better than what most brokers offer.
Sponsored ContentValuation is complex, but we're here to simplify it.
Discover if HYOJITO might be undervalued or overvalued with our detailed analysis, featuring fair value estimates, potential risks, dividends, insider trades, and its financial condition.
Access Free AnalysisHave feedback on this article? Concerned about the content? Get in touch with us directly. Alternatively, email editorial-team (at) simplywallst.com.
This article by Simply Wall St is general in nature. We provide commentary based on historical data and analyst forecasts only using an unbiased methodology and our articles are not intended to be financial advice. It does not constitute a recommendation to buy or sell any stock, and does not take account of your objectives, or your financial situation. We aim to bring you long-term focused analysis driven by fundamental data. Note that our analysis may not factor in the latest price-sensitive company announcements or qualitative material. Simply Wall St has no position in any stocks mentioned.
About TSE:7368
Flawless balance sheet and good value.
Market Insights

Community Narratives
