
Advertisement

The external fund manager backed by Berkshire Hathaway's Charlie Munger, Li Lu, makes no bones about it when he says 'The biggest investment risk is not the volatility of prices, but whether you will suffer a permanent loss of capital.' When we think about how risky a company is, we always like to look at its use of debt, since debt overload can lead to ruin. We can see that and factory,inc. (TSE:7035) does use debt in its business. But the more important question is: how much risk is that debt creating?
When Is Debt A Problem?
Debt and other liabilities become risky for a business when it cannot easily fulfill those obligations, either with free cash flow or by raising capital at an attractive price. Part and parcel of capitalism is the process of 'creative destruction' where failed businesses are mercilessly liquidated by their bankers. However, a more frequent (but still costly) occurrence is where a company must issue shares at bargain-basement prices, permanently diluting shareholders, just to shore up its balance sheet. Having said that, the most common situation is where a company manages its debt reasonably well - and to its own advantage. The first thing to do when considering how much debt a business uses is to look at its cash and debt together.
How Much Debt Does and factoryinc Carry?
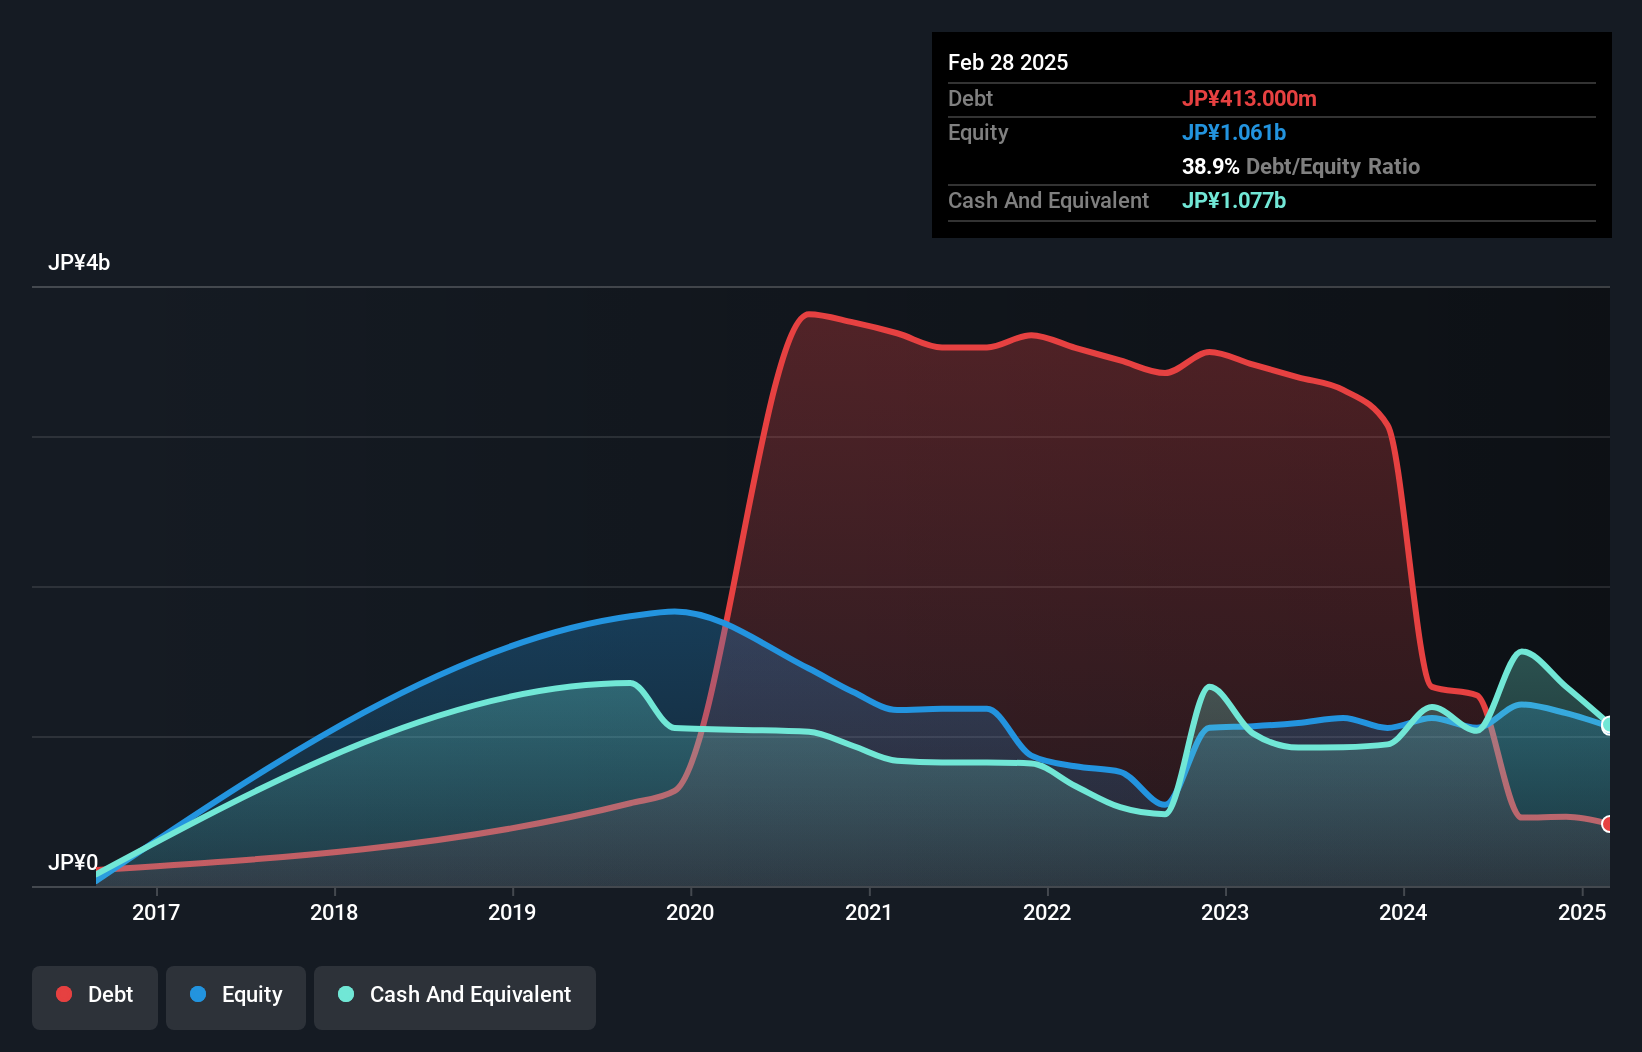
The image below, which you can click on for greater detail, shows that and factoryinc had debt of JP¥413.0m at the end of February 2025, a reduction from JP¥1.33b over a year. But it also has JP¥1.08b in cash to offset that, meaning it has JP¥664.0m net cash.
How Strong Is and factoryinc's Balance Sheet?
According to the last reported balance sheet, and factoryinc had liabilities of JP¥921.0m due within 12 months, and liabilities of JP¥254.0m due beyond 12 months. Offsetting this, it had JP¥1.08b in cash and JP¥545.0m in receivables that were due within 12 months. So it can boast JP¥447.0m more liquid assets than total liabilities.
This surplus suggests that and factoryinc has a conservative balance sheet, and could probably eliminate its debt without much difficulty. Simply put, the fact that and factoryinc has more cash than debt is arguably a good indication that it can manage its debt safely. When analysing debt levels, the balance sheet is the obvious place to start. But you can't view debt in total isolation; since and factoryinc will need earnings to service that debt. So if you're keen to discover more about its earnings, it might be worth checking out this graph of its long term earnings trend.
View our latest analysis for and factoryinc
In the last year and factoryinc had a loss before interest and tax, and actually shrunk its revenue by 36%, to JP¥3.2b. To be frank that doesn't bode well.
So How Risky Is and factoryinc?
By their very nature companies that are losing money are more risky than those with a long history of profitability. And the fact is that over the last twelve months and factoryinc lost money at the earnings before interest and tax (EBIT) line. Indeed, in that time it burnt through JP¥536m of cash and made a loss of JP¥62m. But at least it has JP¥664.0m on the balance sheet to spend on growth, near-term. Even though its balance sheet seems sufficiently liquid, debt always makes us a little nervous if a company doesn't produce free cash flow regularly. When analysing debt levels, the balance sheet is the obvious place to start. But ultimately, every company can contain risks that exist outside of the balance sheet. We've identified 2 warning signs with and factoryinc (at least 1 which is a bit concerning) , and understanding them should be part of your investment process.
When all is said and done, sometimes its easier to focus on companies that don't even need debt. Readers can access a list of growth stocks with zero net debt 100% free, right now.
New: AI Stock Screener & Alerts
Our new AI Stock Screener scans the market every day to uncover opportunities.
• Dividend Powerhouses (3%+ Yield)
• Undervalued Small Caps with Insider Buying
• High growth Tech and AI Companies
Or build your own from over 50 metrics.
Have feedback on this article? Concerned about the content? Get in touch with us directly. Alternatively, email editorial-team (at) simplywallst.com.
This article by Simply Wall St is general in nature. We provide commentary based on historical data and analyst forecasts only using an unbiased methodology and our articles are not intended to be financial advice. It does not constitute a recommendation to buy or sell any stock, and does not take account of your objectives, or your financial situation. We aim to bring you long-term focused analysis driven by fundamental data. Note that our analysis may not factor in the latest price-sensitive company announcements or qualitative material. Simply Wall St has no position in any stocks mentioned.
About TSE:7035
and factoryinc
Engages in the development and operation of smartphone apps.
Flawless balance sheet and slightly overvalued.
Market Insights

Advertisement
Community Narratives
Pole position to benefit from GENIUS Act
Fair Value US$233.04|59.7% undervalued
CH
Community Contributor
IREN will transform from bitcoin miner to leader in AI infrastructure
Fair Value US$21.48|13.5% undervalued
KA
Community Contributor
Behind the Assay: XRF Scientific’s Role in Modern Mining Economics
Fair Value AU$2.10|1.4% undervalued
RO
Community Contributor