- Japan
- /
- Entertainment
- /
- TSE:6879
IMAGICA GROUP Full Year 2025 Earnings: Revenues Beat Expectations, EPS Lags


IMAGICA GROUP (TSE:6879) Full Year 2025 Results
Key Financial Results
- Revenue: JP¥96.9b (down 2.8% from FY 2024).
- Net loss: JP¥3.72b (down by 257% from JP¥2.37b profit in FY 2024).
- JP¥83.97 loss per share (down from JP¥53.57 profit in FY 2024).
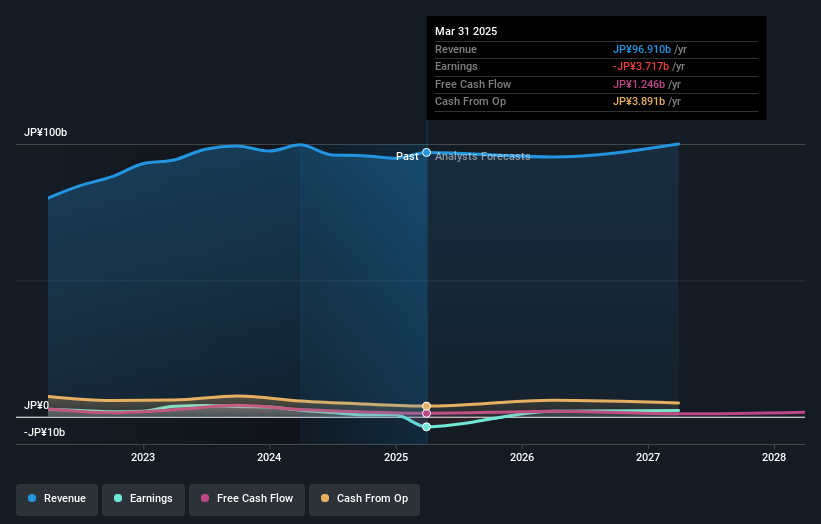
All figures shown in the chart above are for the trailing 12 month (TTM) period
IMAGICA GROUP Revenues Beat Expectations, EPS Falls Short
Revenue exceeded analyst estimates by 3.4%. Earnings per share (EPS) missed analyst estimates significantly.
Looking ahead, revenue is forecast to grow 1.6% p.a. on average during the next 2 years, compared to a 11% growth forecast for the Entertainment industry in Japan.
Performance of the Japanese Entertainment industry.
The company's shares are up 42% from a week ago.
Risk Analysis
Don't forget that there may still be risks. For instance, we've identified 2 warning signs for IMAGICA GROUP that you should be aware of.
New: AI Stock Screener & Alerts
Our new AI Stock Screener scans the market every day to uncover opportunities.
• Dividend Powerhouses (3%+ Yield)
• Undervalued Small Caps with Insider Buying
• High growth Tech and AI Companies
Or build your own from over 50 metrics.
Have feedback on this article? Concerned about the content? Get in touch with us directly. Alternatively, email editorial-team (at) simplywallst.com.
This article by Simply Wall St is general in nature. We provide commentary based on historical data and analyst forecasts only using an unbiased methodology and our articles are not intended to be financial advice. It does not constitute a recommendation to buy or sell any stock, and does not take account of your objectives, or your financial situation. We aim to bring you long-term focused analysis driven by fundamental data. Note that our analysis may not factor in the latest price-sensitive company announcements or qualitative material. Simply Wall St has no position in any stocks mentioned.
About TSE:6879
Flawless balance sheet and fair value.
Market Insights

Community Narratives


